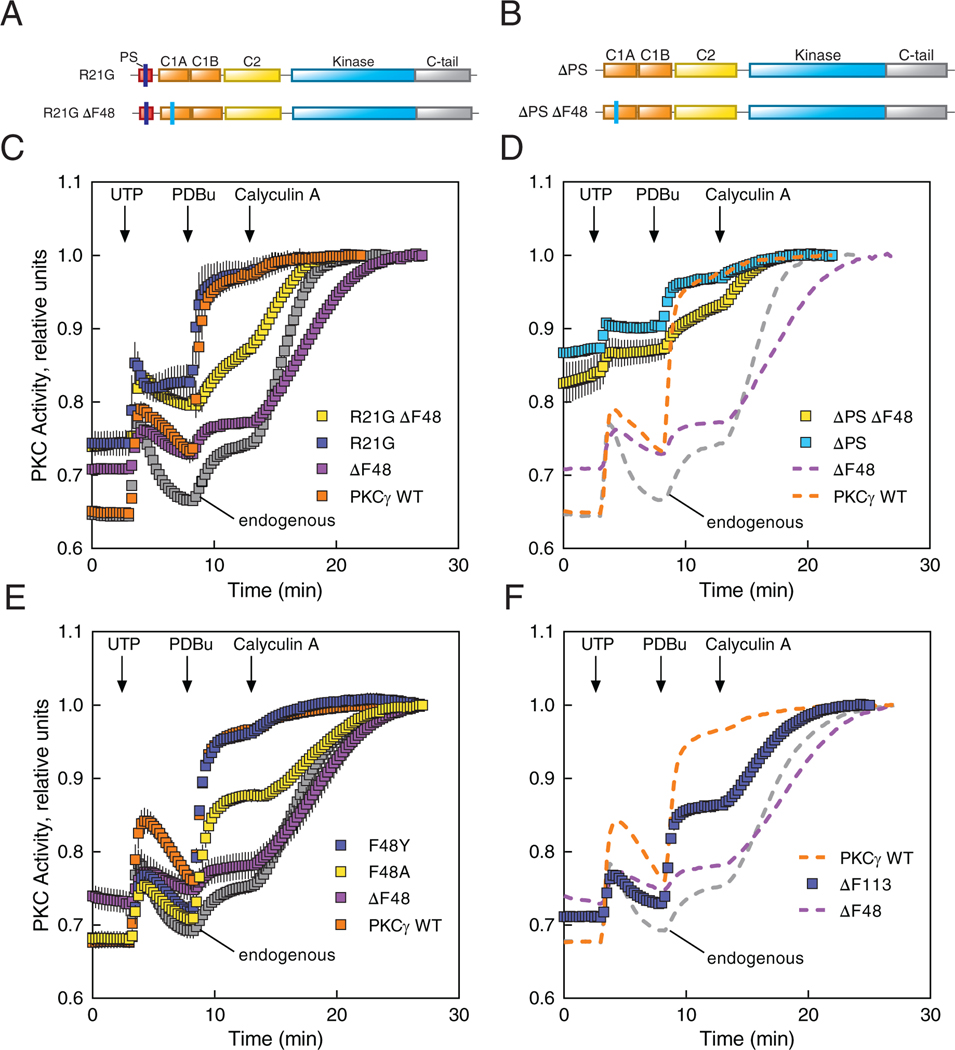
Figure 6. SCA14 mutant ΔF48 displays an abrogated response to agonists.
(A and B) Domain structures of PKCγ constructs containing the mutated pseudosubstrate (R21G) alone or combined with Phe48-deleted (R21G ΔF48) (A), and the pseudosubstrate-deleted (ΔPS) alone or combined with Phe48-deleted (ΔPS ΔF48) (B). (C and D) COS7 cells were transfected with CKAR2 alone (endogenous; gray) or co-transfected with CKAR2 and the indicated mCherry-tagged PKCγ constructs: WT (orange), ΔF48 (purple), or the mutants shown in (A) and (B), respectively. PKC activity was monitored by measuring FRET/CFP ratio changes after addition of 100 μM UTP, 200 nM PDBu, and 50 nM calyculin A. Data were normalized to the endpoint (1.0) and represent mean ± S.E.M. from at least two independent experiments, N ≥ 20 cells per condition. In (D), the PKCγ WT, ΔF48, and endogenous data (dashed lines) are reproduced from (C) for direct comparison purposes. (E and F) COS7 cells were transfected with CKAR2 alone (endogenous) or co-transfected with CKAR2 and the indicated mCherry-tagged PKCγ constructs (E) or the SCA14 mutant ΔF113 (F). PKC activity was monitored, analyzed, and shown as described in (C and D), from at least three independent experiments of N ≥ 49 (E) or 31 (F) cells per condition. In (F), the PKCγ WT, ΔF48, and endogenous data (dashed lines) are reproduced from (E) for direct comparison purposes.

