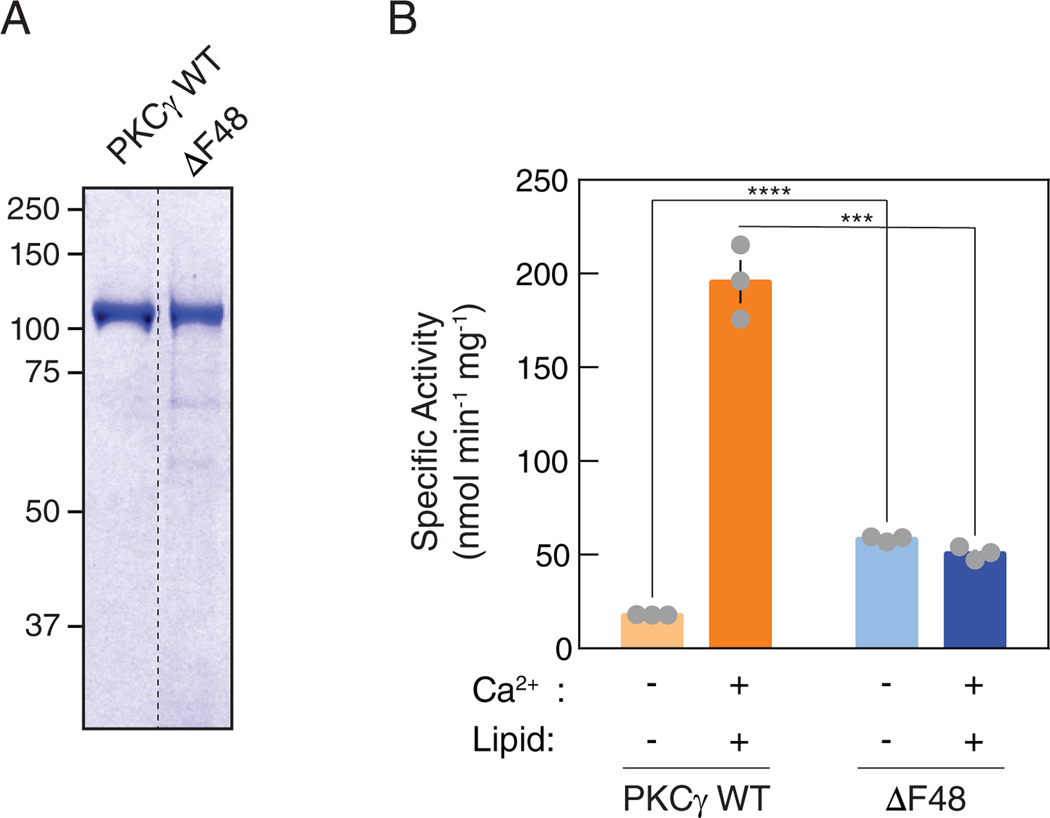
Figure 7. Purified ΔF48 exhibits increased activity compared to WT PKCγ under non- activating conditions.
(A) Coomassie Blue-stained SDS-PAGE gel of purified GST-PKCγ WT or ΔF48. (B) In vitro kinase assays of purified GST-PKCγ WT or ΔF48 (6.1 nM per reaction). PKC activity was measured under non-activating conditions (EGTA, absence of Ca2+ or lipids) or activating conditions (presence of Ca2+ and lipids). Data are graphed in nanomoles phosphate per minute per milligram GST-PKC. Data are mean ± S.E.M. from three independent experiments, N = 9 reactions per condition. ***P<0.001, ****P<0.0001 by Holm-Sidak multiple comparison t-tests.

