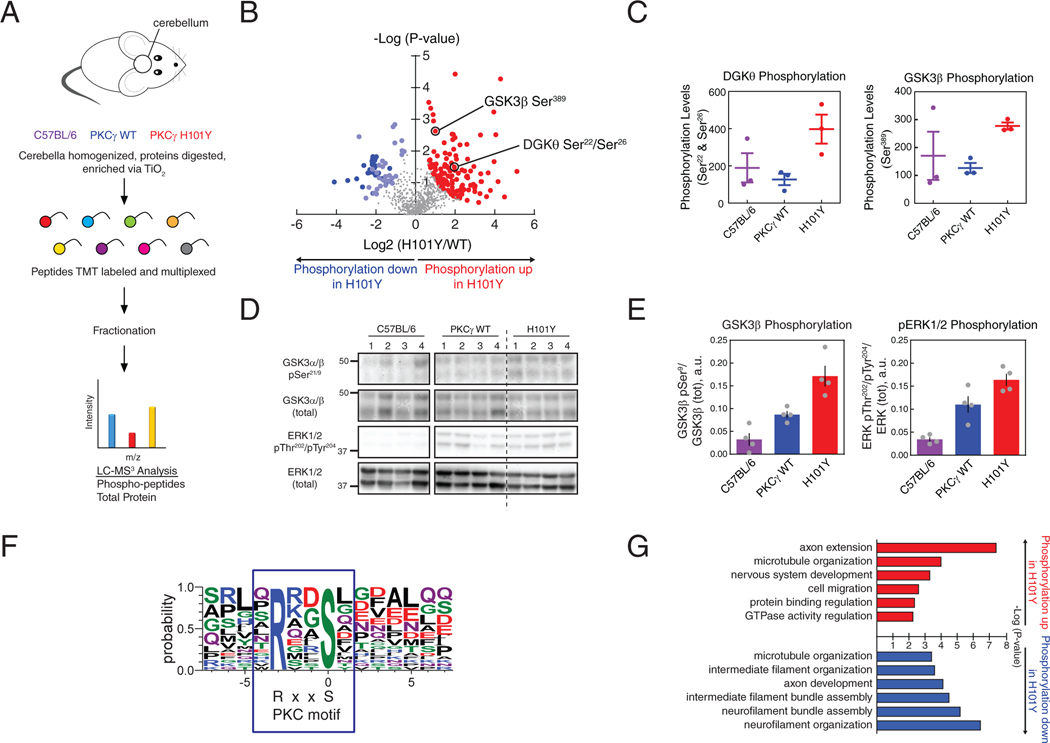
Figure 8. Phosphoproteomics analysis from cerebella of mice expressing human WT or H101Y PKCγ transgene.
(A) Experimental design for processing of mouse tissue and proteins. Cerebella from B6 background (purple), PKCγ WT transgenic (blue), and PKCγ H101Y transgenic (red) mice at 6 months of age were subjected to phosphoprotemics analysis. 6893 total proteins were quantified in the standard proteomics and 914 quantifiable phosphopeptides were detected in the phosphoproteomics. After correction for protein expression, 195 phosphopeptides on 166 unique proteins were identified in H101Y-expressing mice. N = 3 mice of C57BL/6, PKCγ WT, PKCγ H101Y. (B) Volcano plot of phosphopeptide replicates of cerebella from WT and H101Y transgenic mice. Graph represents the log-transformed p-values (Student’s t-test) linked to individual phosphopeptides versus the log-transformed fold change in phosphopeptide abundance between WT and H101Y cerebella. Color represents phosphopeptides with significant changes in P-value and fold change; red, increased phosphorylation in H101Y mice; blue, lower phosphorylation in H101Y mice (dark blue indicates significantly decreased neurofilament phosphopeptides, light blue indicates all other significantly decreased phosphopeptides). (C) Graphs representing quantification of either a DGKθ phosphopeptide (left) or a GSK3β phosphopeptide (right) from the volcano plot in (B) in cerebella from C57BL/6 mice (purple), WT mice (blue), and H101Y mice (red). (D and E) Western blotting analysis of Triton-soluble cerebellar tissue lysates from C57BL/6, PKCγ WT, or H101Y mice. Membranes were probed with antibodies against GSK3α/β pSer21/9, GSK3α/β (total), ERK1/2 pThr202/pTyr204, or ERK1/2 (total). Quantification of blots from N = 4 mice per genotype, for GSK3β phosphorylation (pSer9; left) and ERK1/2 phosphorylation (pThr202/pTyr204; right), are shown in (E). Data are mean + S.E.M. (F) Motif analysis of RxxpS PKC consensus substrate sequence in significantly increased phosphopeptides. RxxpS was detected in 24 of 77 sequences of length 15 after removing background. Fold increase of RxxpS phosphopeptide abundance in H101Y:WT cerebellum = 5.3. (G) Gene ontology analysis of significantly increased (red) or decreased (blue) phosphopeptides representing significantly changed biological processes.

