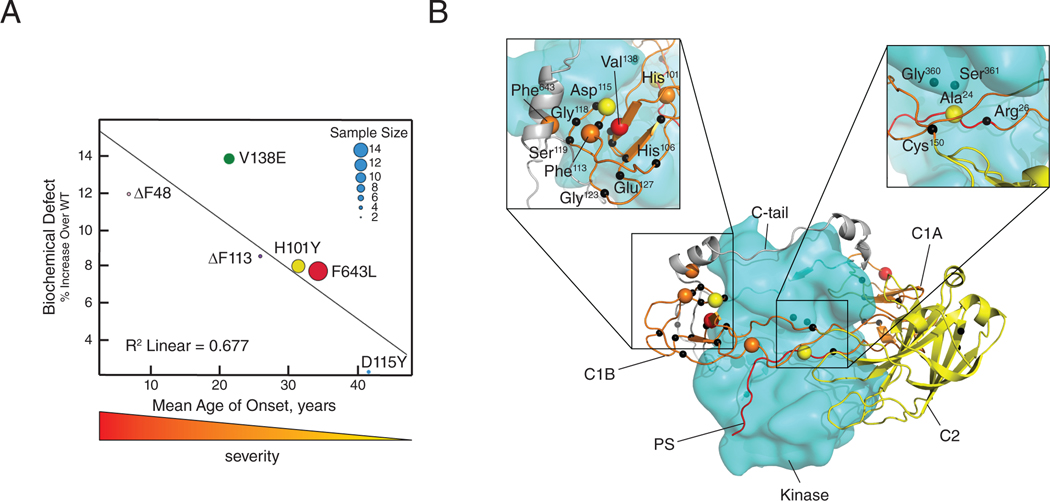
Figure 9. Degree of ataxia mutant biochemical defect correlates with SCA14 severity.
(A) Graph of the indicated SCA14 mutant basal activities from Fig. 2, B, C, and E, and Fig. 6F plotted against average age of disease onset in patients (14, 53–58). Sample size, between 2 and 14 patients, is indicated by dot size. (B) PKCγ model based on the previously published model of PKCβII (18). Indicated SCA14 mutations are represented as black spheres; the five mutations presenting in (A) are color coded by disease severity.

