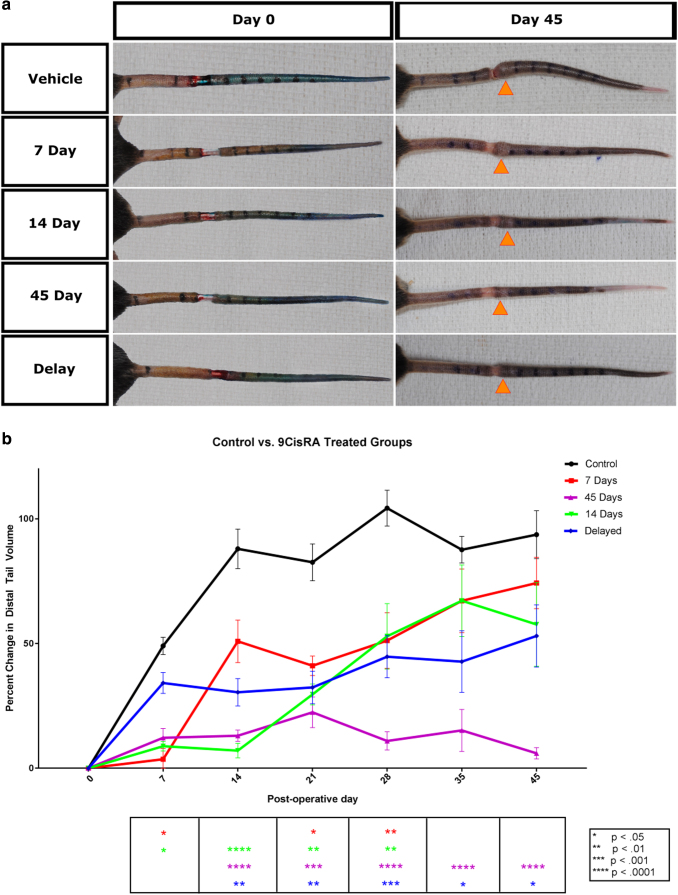
FIG. 1.
Effect of 9-cis retinoic acid on lymphedema. (a) Representative photos of mouse tails on the day of surgical excision of lymphatics and on the final day of the experiment. Orange arrows indicate the location of the largest tail circumference on day 45 in each group. (b) Graphical representation of percent change in tail volume from baseline volume as a function of time. Graph compares the increase in tail volume of the control group with delay, 7-, 14-, and 45-day groups. Values are reported as mean ± standard error.

