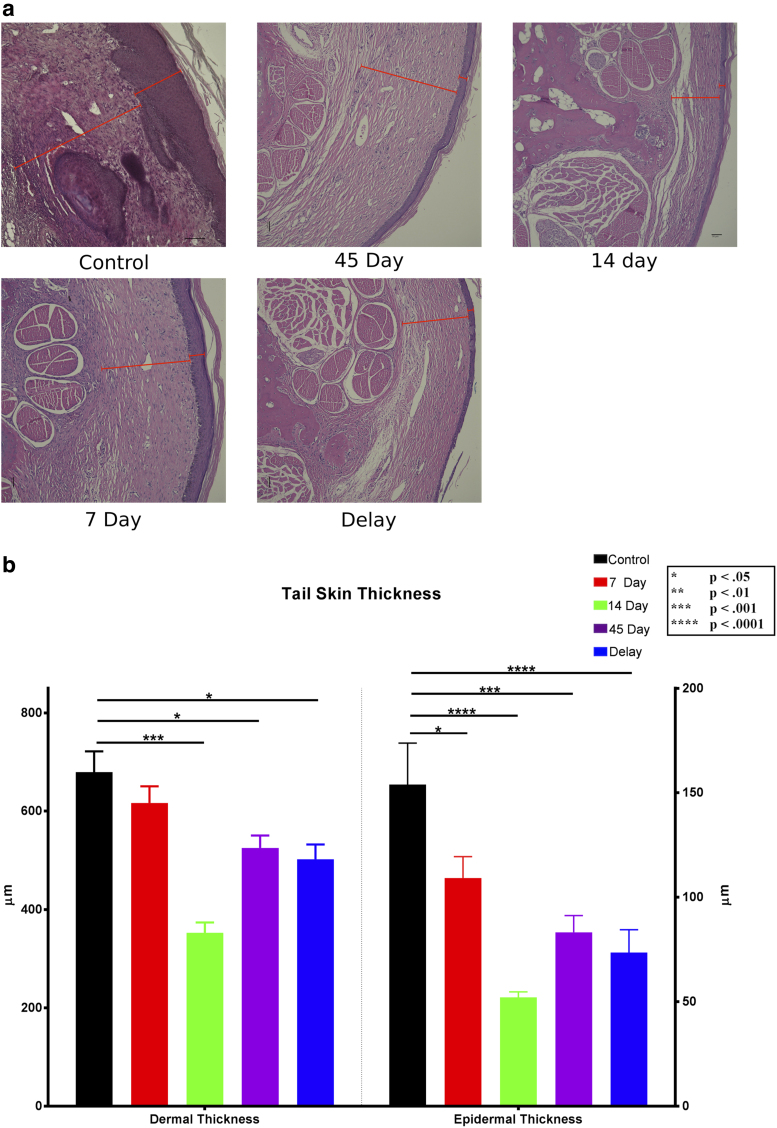
FIG. 4.
Dermal and epidermal thicknesses. (a) Representative 10 × cross-sectional images of H&E-stained tails. Red indicators represent the thickness of the dermis (inner lines) and epidermis (outer lines). Scale bar in the 14-day group: 50 μm. Scale bar in the control group: 100 μm. (b) Quantification of dermal and epidermal thicknesses from H&E-stained slides. The control group had a significantly thicker epidermis than the 7-, 14-, and 45-day and delay groups (p = 0.0411, 0.0001, 0.0001, and 0.0001, respectively). The dermis in control tails was also significantly thicker than the 14- and 45-day and delay groups (p = 0.0001, 0.0357, and 0.0141, respectively). H&E, hematoxylin and eosin.

