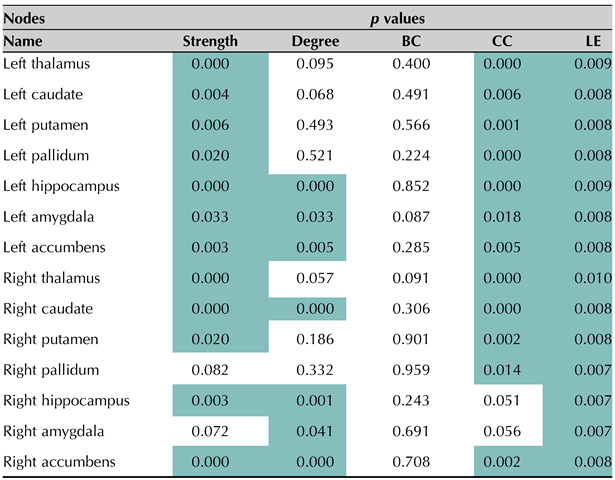
Table 3. .
Detail of p values obtained from comparing healthy volunteers (HVs) with people with MS in all deep gray matter regions for each of the multilayer metrics: strength, degree, betweenness centrality (BC), closeness centrality (CC), and local efficiency (LE).