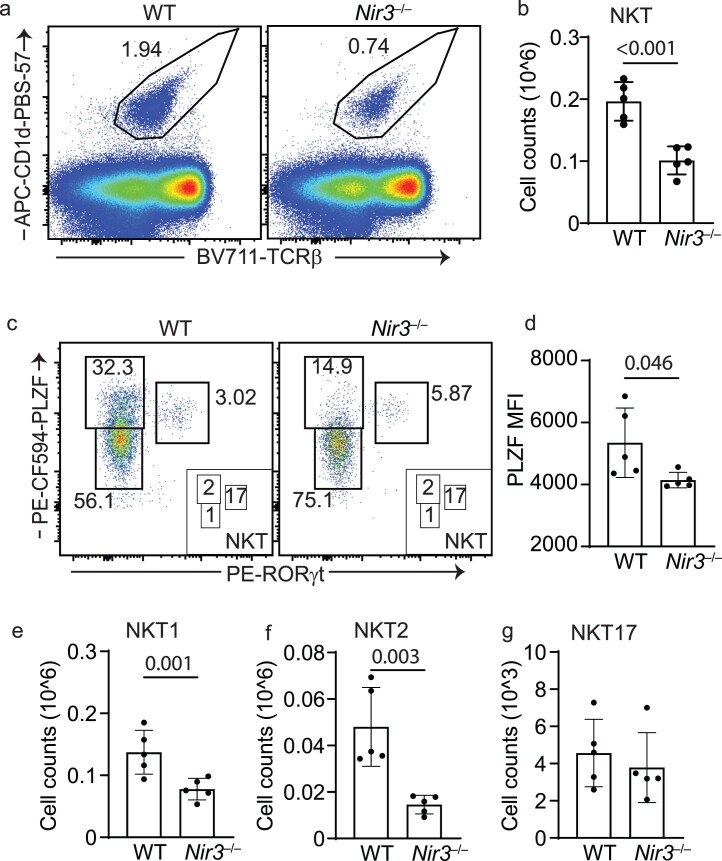
Extended Data Fig. 3. Decreased thymic NKT cells in Nir3–/– mice.
(a) Representative staining of NKT cells gated as TCRβint, CD1d-PBS-57 tetramer+ cells in live, CD8-negative thymocytes from WT and Nir3–/– thymus. (b) Absolute numbers of thymic NKT cells in the WT and Nir3–/– mice. (c) NKT cell subsets were gated as PLZFlo RORγt- (NKT1), PLZFhi RORγt- (NKT2) and PLZFint RORγt+ (NKT17). (d) PLZF expression levels in total WT and Nir3–/– NKT cells. (e-g) Absolute numbers of the NKT cell subsets in WT and Nir3–/– mice. N = 5 mice. Data are shown as the mean ± s.e.m. and are representative of two independent experiments. P values were determined using a two-tailed Student’s t-test.

