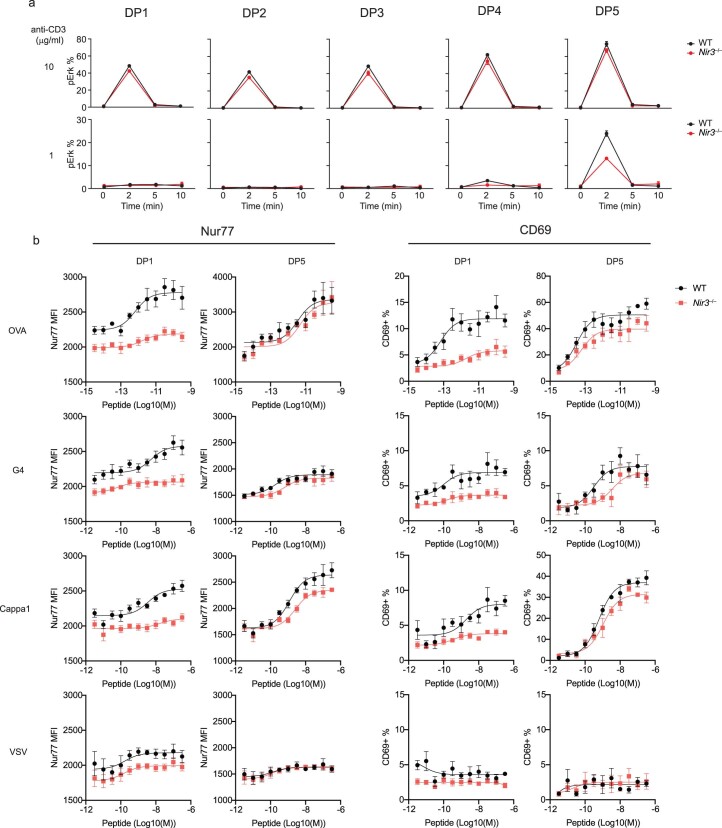
Extended Data Fig. 9. Nir3 modulates Erk and Nur77 activation induced by weak TCR stimulation.
(a) WT or Nir3–/– DP thymocytes were stimulated with indicated amount of anti-CD3 at 0 min. Erk phosphorylation were assessed by flow cytometry. N = 3. The data are shown as the mean ± s.e.m. (b) WT or Nir3–/– OT-I DP1 and DP5 thymocytes were sorted by flow cytometry and co-cultured with full agonist (OVA), weak agonist (G4), positive selecting (Cappa1) and non-binding (VSV) peptide variants. After 3 hours, Nur77 expression and the percentage of thymocytes expressing CD69 were measured. N = 4. The data are shown as the mean ± s.e.m. with fitted curve (three parameters). Data are representative of two independent experiments.

