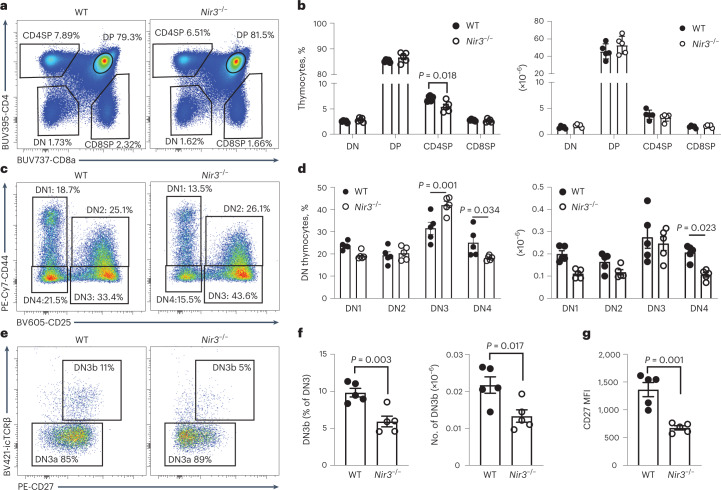
Fig. 3. Nir3 deficiency leads to a blockade of thymocyte development at the TCRβ-selection stage.
a,b, Representative flow plots (a) and quantification (b) of CD4 versus CD8 profiles of thymocytes from 8-week-old Nir3–/– and WT female mice. c,d, Representative flow plots (c) and quantification (d) of DN1 to DN4 subsets of DN thymocytes. e,f, Representative flow plots (e) and quantification (f) of DN3a and DN3b subsets of DN3 thymocytes. g, CD27 expression on DN3 cells. n = 5. Data are representative of at least three independent experiments and are expressed as mean the ± s.e.m. P values were determined using two-way ANOVA with multiple comparisons (b,d) or an unpaired, two-tailed Student’s t-test (f,g).

