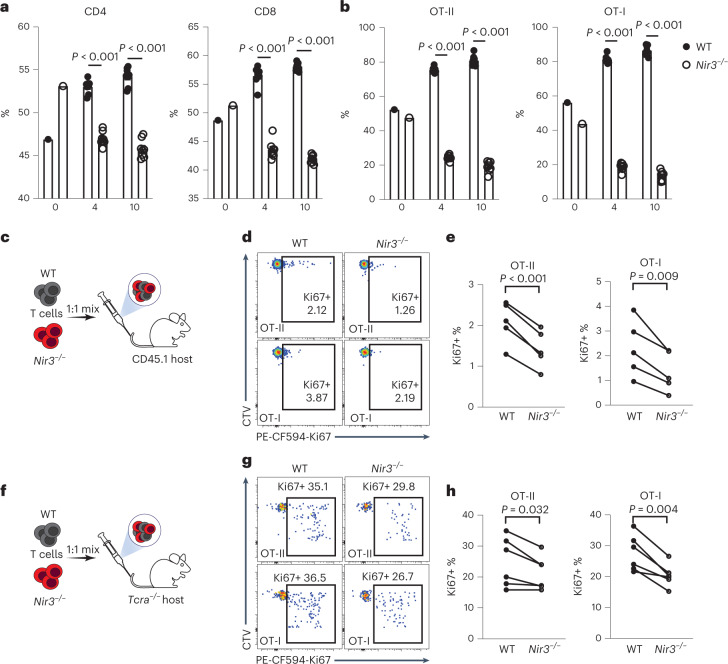
Fig. 6. Nir3 regulates mature T cell survival in the periphery.
a,b, WT T cells and Nir3–/– T cells labeled by CellTrace dyes were mixed at a 1:1 ratio and adoptively transferred into 6- to 8-week-old WT male recipient mice. Four and 10 days after the transfer, the percentages of transferred WT CD4, CD8 (a), OT-II, or OT-I (b) in total surviving transferred cells were quantified. n = 8 mice. c–h, WT and Nir3–/– OT-I and OT-II T cells labeled by CellTrace Violet dyes (CTV) were mixed at a 1:1 ratio and adoptively transferred into CD45.1 male recipient mice (c–e) or Tcra–/– male mice (f–h) for 4 days. Representative flow plots (d,g) and quantification (e,h) of Ki67-expressing cells in transferred cells are shown. WT and Nir3–/– donor cells recovered from the same recipient mouse were connected with lines. n = 5 mice. Data are shown as the mean ± s.e.m. and are representative of at least two independent experiments. P values were determined using an unpaired (a,b) or a paired (e,h), two-tailed Student’s t-test.

