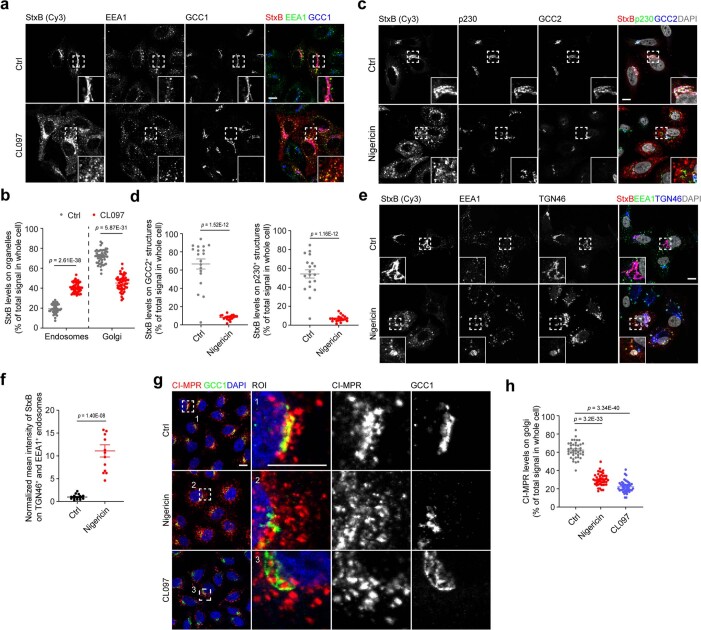
Extended Data Fig. 9. NLRP3 activators disrupt ETT resulting in endosomal retention of cargo.
a, StxB internalization in HeLa cells treated or not with 45 μg ml−1 CL097. Cy3-conjugated StxB was added 20 min after CL097 addition. Cells were fixed 40 min after Cy3-conjugated StxB incubation and immunolabeld for EEA1 and GCC1. Magnifications of areas in dashed squares shown in the right corner. Scale bar: 10 μm. b, StxB level quantification on endosomes and Golgi in experiments shown in panel a. Means ± SD, N = 3, n = 47 cells for control (Ctrl)-treated and n = 48 cells for CL097-treated group. c, StxB internalization in HeLa cells treated or not with 10 µM nigericin. StxB labeling as described for panel a. Cells were immunolabeled for p230 and GCC2. Magnifications of areas in dashed squares shown in the lower right corner. Scale bar: 10 µm. d, StxB level quantification on p230- (right) and GCC2-positive (left) structures in experiments shown in panel c. Means ± SD, N = 3, n = 19 cells for control (Ctrl)-treated and n = 19 cells for nigericin-treated group. e, StxB internalization StxB in HeLa cells as described for panel a. Cells were immunolabeled for EEA1 and TGN46. Magnifications of areas in dashed squares shown in the lower left corner. Scale bar: 10 µm. f, Relative StxB intensity on EEA1-TGN46 double positive endosomes in experiments shown in panel e. Means ± SD, N = 3, n = 15 cells for control-treated and n = 13 cells for nigericin-treated group. g, CI-MPR antibody internalization in HeLa cells treated or not with 10 μM nigericin or 45 μg ml−1 CL097. An antibody recognizing CI-MPR was added 5 min after nigericin or 20 min after CL097 addition. Cells were fixed 40 min after CI-MPR antibody incubation and were immunolabeled for GCC1. Magnifications of areas in numbered dashed squares shown in separate numbered images. Scale bar: 10 μm. h, CI-MPR level quantification on Golgi in experiments shown in panel g. Means ± SD, N = 3, n = 42 cells for control (Ctrl)-treated, n = 45 cells for nigericin-treated and n = 44 cells for CL097-treated group. DAPI was used to stain the nucleus in all experiments. Data were analyzed with an unpaired two-sided t-test (b, d, f, h). Data shown in a, c, e, g are representative of at least three independent experiments.

