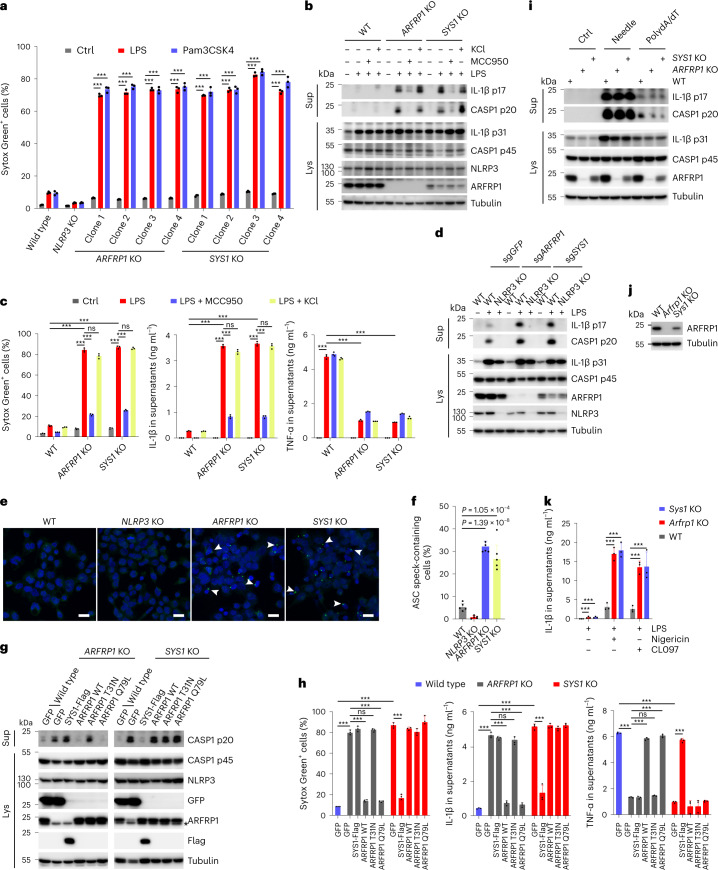
Fig. 7. Defective ETT promotes NLRP3 inflammasome activation.
a, Cellular uptake of Sytox Green in THP-1 cells with indicated genotypes treated or not treated with 1 μg ml−1 LPS or Pam3CSK4 for 2 h. Mean ± s.d., N = 3. ***P < 0.001. b, Immunoblotting of supernatants and cell lysates from THP-1 cells with indicated genotypes treated or not treated with 1 μg ml−1 LPS in the absence or presence of 10 μM MCC950 or 20 mM KCl for 2 h. c, Cellular uptake of Sytox Green and ELISA analysis of cytokine secretion in experiments shown in b. Mean ± s.d., N = 3. ***P < 0.001; ns, not significant. d, Immunoblotting of culture supernatants and lysates from THP-1 cells. THP-1 cells with indicated genotypes expressing sgRNAs against ARFRP1 or SYS1 were treated with 1 μg ml−1 LPS for 2 h. e, Confocal images of THP-1 cells with indicated genotypes treated with 1 μg ml−1 LPS for 2 h stained with an antibody against ASC. Arrowheads indicate ASC specks. Scale bar, 20 μm. f, Quantification of ASC speck-containing cells in experiments shown in g. Mean ± s.d., N = 3, n = 100 cells for each group. ***P < 0.001. g, Immunoblotting of supernatants and lysates from THP-1 cells with indicated genotypes expressing GFP, Flag-SYS1, WT ARFRP1, T31N or Q79L mutant ARFRP1 treated with 1 μg ml−1 LPS for 2 h. h, Cellular uptake of Sytox Green and ELISA analysis of cytokine secretion in experiments shown in g. Mean ± s.d., N = 3. ***P < 0.001; ns, not significant. i, Immunobloting of supernatants and lysates from THP-1 cells with indicated genotypes treated or not treated with FLn-Needle plus anthrax protective antigen or transfected with poly(dA:dT) for 4 h. j, Validation of generation of Arfrp1 KO and Sys1 KO iBMDMs. k, ELISA of IL-1β in supernatants from iBMDMs with indicated genotypes. After LPS for 4 h, cells were treated with 7.5 μM nigericin or 50 μM CL097 for 30 min. Mean ± s.d., N = 3. ***P < 0.001. Data were analyzed with an unpaired two-sided t-test (a, c, f, h, k). Data shown in b, d, e, g, i and j are representative of at least three independent experiments.

