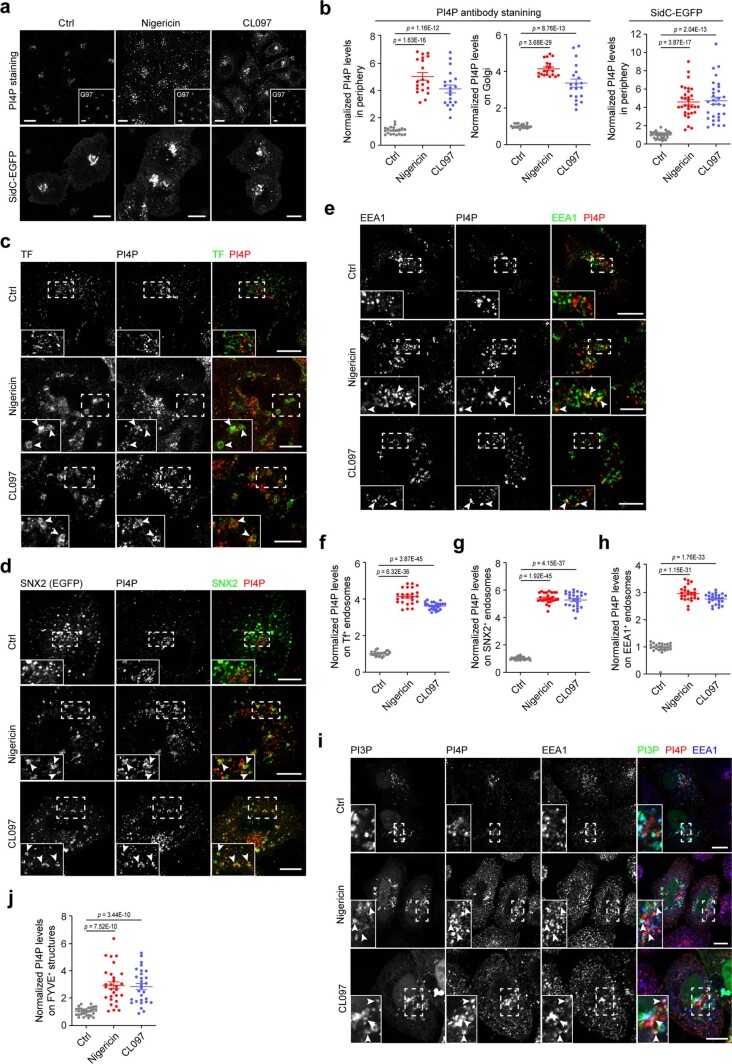
Extended Data Fig. 1. NLRP3 activators trigger PI4P accumulation on endosomes in HeLa cells.
a, Confocal images of WT and SidC-GFP-expressing HeLa cells treated with vehicle (Ctrl), 15 µM nigericin or 45 µg ml−1 CL097 for 60 min. An antibody against PI4P and against the TGN marker Golgin97 (G97) was used (lower left corner) or the distribution of SidC-GFP was analyzed. Scale bar: 10 µm. b, Quantification of PI4P levels in cells in experiments shown in panel a. N = 3, n = 20 cells for each group. c, Airyscan images of HeLa cells treated with vehicle (Ctrl), 15 µM nigericin or 45 µg ml−1 CL097 and 5 µg ml−1 Alexa488-conjugated Transferrin (Tf) for 60 min. After fixation, cells were stained with an antibody against PI4P. Magnifications of areas in dashed squares shown in the lower left corner. Arrowheads indicate TF-positive structures containing PI4P. Scale bar: 10 µm. d, Airyscan images of HeLa cells expressing SNX2-eGFP treated as in experiment shown in panel a. Cells were stained with an antibody against PI4P. Magnifications of areas in dashed squares shown in the lower left corner. Arrowheads indicate SNX2-eGFP-positive structures containing PI4P. Scale bar: 10 µm. e, Airyscan images of HeLa cells treated as in experiment shown in panel a. Cells were co-stained with antibodies against PI4P and EEA1. Magnifications of areas in dashed squares shown in the lower left corner. Arrowheads indicate EEA1-positive structures containing PI4P. Scale bar: 10 µm. f, g, h, Quantification of PI4P levels on Tf-, SNX2-eGFP and EEA1-positive structures in cells in experiments as described for panel c. Means ± SD, N = 3, n = 30 cells for each group. i, Confocal images of HeLa cells expressing GFP-tagged FYVE domain of SARA treated as in experiment shown in panel a. After fixation, cells were co-stained with an antibody against PI4P and EEA1. Magnifications of areas in dashed squares shown in the lower left corner. Arrowheads indicate FYVE-GFP-positive structures containing PI4P and EEA1. Scale bar: 10 µm. j, Quantification of PI4P levels on FYVE-GFP-positive structures in experiments shown in panel i. Means ± SD, N = 3, n = 30 cells for each group. Data were analyzed with an unpaired two-sided t-test (b, f, g, h). Data shown in a, c, d, e, i are representative of at least three independent experiments.

