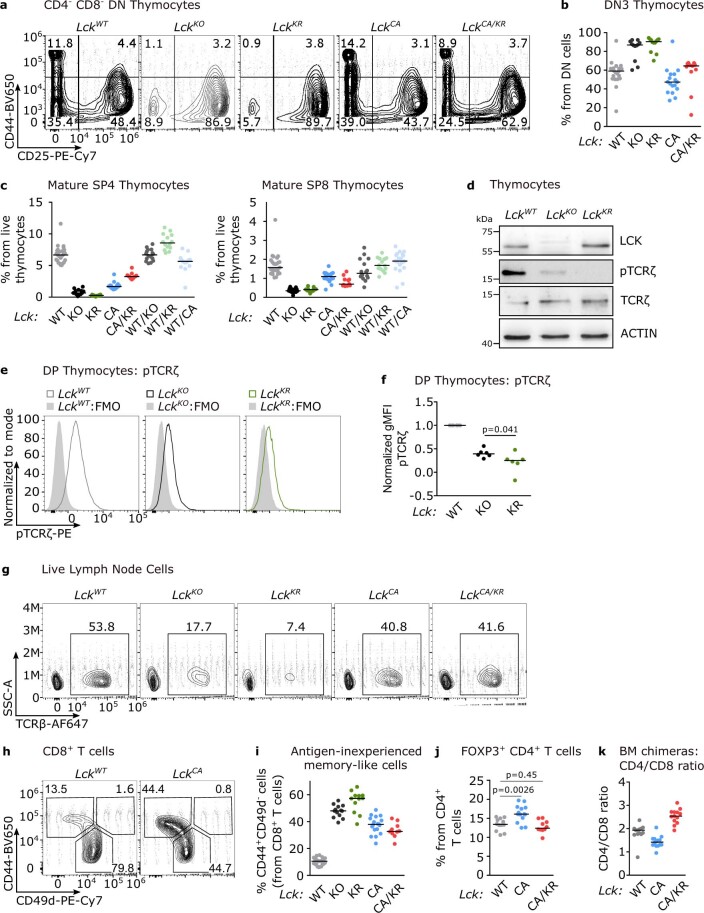
Extended Data Fig. 3. Characterization of the T-cell compartment in Lck variant mice.
(a-f) Thymocytes and (g-j) LN cells from the indicated mice were analyzed by flow cytometry. (a-b) The percentage of cells at the DN3 stage (CD44− CD25+) out of all DN (viable CD4− CD8α-) thymocytes is shown. (a) Representative mice. (b) Individual values and medians are shown. LckWT/WT: n = 22 mice in 10 independent experiments, LckKO/KO: 12/6, LckKR/KR: 12/6, LckCA/CA: 17/7, LckCA/KR: 11/5. (c) Percentages of mature SP4 (TCRβ+ CD24−CD4+ CD8α-) and mature SP8 (TCRβ+ CD24−CD4− CD8α+) thymocytes. LckWT/WT: n = 25 mice in 11 independent experiments, LckKO/KO: 13/7 independent experiments, LckKR/KR: 12/6 independent experiments, LckCA/CA: 18/8, LckCA/KR: 11/5, LckWT/KO: 16/7, LckWT/KR: 14/8, LckWT/CA: 19/8. Individual values and medians are shown. (d) Phosphorylation of TCRζ was in thymocytes from the indicated mice was analyzed by immunoblotting. A representative experiment out of 3 in total. (e-f) Phosphorylation of TCRζ in thymocyte subpopulations determined by flow cytometry. (e) A representative experiment out of 6 in total. (f) Normalized TCRζ phosphorylation (net gMFI of LckWT mice were set as 1). n = 6 independent experiments/mice. Means are shown. The statistical significance was determined using a Mann Whitney test. (g) Frequency of TCRβ+ LN cells was analyzed by flow cytometry. A representative experiment out of 11 for LckWT/WT, 7 for LckKO/KO, 6 for LckKR/KR, 8 for LckCA/CA and 5 for LckCA/KR mice in total. (h-i) A percentage of CD44+ CD49d− T cells out of CD8+ T cells was determined by flow cytometry. (h) Representative samples of LckWT/WT and LckCA/CA mice are shown. (i) Individual values and medians are shown. LckWT/WT: 25 mice in 11 independent experiments, LckKO/KO: 13/7, LckKR/KR: 12/6, LckCA/CA:18/8, LckCA/KR: 10/5. (j) Frequency of regulatory T cells from overall CD4+ T cells in Lck variant mice is shown. n = 12 LckWT/WT, 14 LckCA/CA, 10 LckCA/KR mice in 3 independent experiments. Statistical significance was calculated using a Mann-Whitney test. (k) Ratio of CD4+/CD8+ T cell counts derived from bone marrows of LckWT/WT, LckCA/CA, and LckCA/KR donors in the mixed bone marrow chimeras (Fig. 1g-h). n = 13 LckWT/WT, 14 LckCA/CA, 13 LckCA/KR mice from 3 independent experiments. Individual values and medians are shown.

