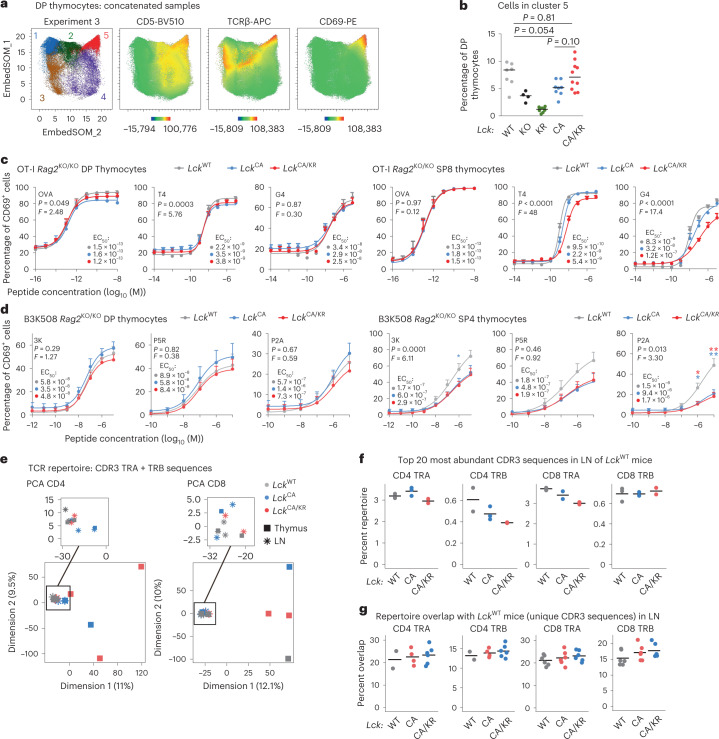
Fig. 2. A modest role of co-receptor–LCK interaction in DP thymocytes.
a,b, EmbedSOM maps of concatenated DP thymocyte samples from Lck-variant mice. a, EmbedSOM maps show individual FlowSOM clusters and the relative expression of indicated markers. A representative experiment out of a total of five experiments is shown. b, Frequency of cells in cluster 5; n = 7 LckWT/WT, n = 4 LckKO/KO, n = 9 LckKR/KR, n = 8 LckCA/CA and n = 10 LckCA/KR in five independent experiments. Medians are shown. Statistical significance was calculated using a Mann–Whitney test. c, Thymocytes from indicated Lck-variant OT-I mice were activated with T2-Kb cells loaded with the indicated peptides (affinity: OVA > T4 > G4) and analyzed for CD69 expression by flow cytometry; n = 3 (OVA and T4) or 4 (G4) independent experiments/mice. d, Thymocytes of indicated Lck-variant B3K508 mice were activated with Ly5.1 splenocytes loaded with indicated peptides (affinity: 3K > P5R > P2A) and analyzed for CD69 expression by flow cytometry; n = 8 (3K and P2A in LckWT/WT and LckCA/CA mice), n = 7 (3K and P2A in LckCA/KR mice) or n = 5 (P5R) independent experiments/mice. Data in c and d are shown as mean + s.e.m. Differences in the EC50 and/or maximum of the fitted non-linear regression curves were tested using an extra sum of squares F-test. F, P and EC50 values are shown. The significance of the differences between LckWT/WT and LckCA/CA mice (blue) and LckWT/WT and LckCA/KR mice (red) at individual concentrations in d was calculated using a Mann–Whitney test; *P < 0.05; **P < 0.01; no symbol, P > 0.05 (Supplementary Table 3). e–g, TCR repertoires of FACS-sorted CD4+ and CD8+ mSP cells in the LNs and thymi from indicated mice were profiled. UMI-corrected counts of TCRα (TRA) and TCRβ (TRB) CDR3 amino acid sequences were normalized after the removal of NKT TRAV11-TRAJ18 CDR3 sequences. Sample sizes are in Supplementary Table 4. e, Principal-component analysis of all samples. f, Percentage of the repertoire in the indicated samples constituted by the top 20 most frequent CDR3 amino acid sequences in the LNs of LckWT/WT mice. g, The repertoire overlap was calculated as the percentage of unique CDR3 amino acid sequences in each sample present among the unique CDR3 sequences from each of the (non-identical) LckWT/WT mice. Each dot represents a single comparison.

