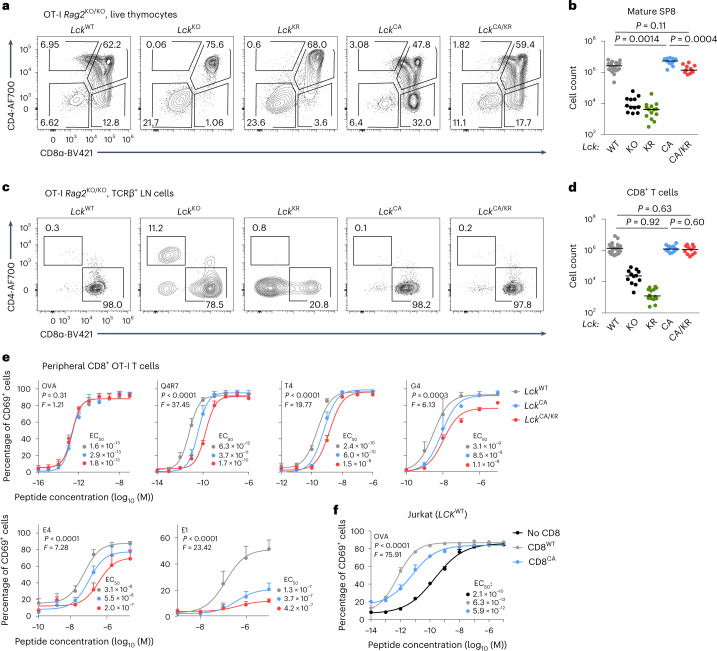
Fig. 4. CD8-bound LCK is largely dispensable for positive selection and T cell activation.
a–d, Thymi (a and b) and LNs (c and d) of indicated Lck-variant OT-I mice were analyzed by flow cytometry. a, Expression of CD4 and CD8α in representative mice (gated on viable cells). b, Numbers of mSP8 (viable CD4−CD8α+CD24−TCRβ+) T cells. Individual mice and medians are shown; n = 22 LckWT/WT mice in 12 independent experiments, n = 12 LckKO/KO mice in 8 independent experiments, n = 14 LckKR/KR mice in 6 independent experiments, n = 13 LckCA/CA mice in 7 independent experiments and n = 11 LckCA/KR mice in 3 independent experiments. The statistical significance was tested using a Mann–Whitney test. c, CD4+ and CD8+ T cells in representative mice (gated on viable TCRβ+ cells). d, Counts of CD8+ T cells. Individual mice and medians are shown; n = 23 LckWT/WT mice in 12 independent experiments, n = 12 LckKO/KO mice in 8 independent experiments, n = 14 LckKR/KR mice in 6 independent experiments, n = 13 LckCA/CA mice in 7 independent experiments and n = 11 LckCA/KR mice in 3 independent experiments. Statistical significance was tested using a Mann–Whitney test. e, T cells isolated from LNs of indicated Lck-variant OT-I Rag2–/– mice were activated ex vivo with T2-Kb cells loaded with the indicated peptides (affinity: OVA > Q4R7 > T4 > G4 > E4 > E1) overnight and analyzed for expression of CD69 by flow cytometry. Data are shown as the mean + s.e.m.; n = 3 independent experiments/mice for OVA and Q4R7 and n = 4 independent experiments/mice for T4, G4, E4 and E1. Differences in the EC50 and/or maximum of the fitted non-linear regression curves were tested using an extra sum of squares F-test. F, P and EC50 values are shown. f, Jurkat cells expressing OT-I TCR and LCKWT were transduced with CD8WT or with CD8CA. These Jurkat cells were activated with T2-Kb cells loaded with OVA peptide overnight and analyzed for CD69 expression by flow cytometry. Data are shown as mean + s.e.m.; n = 3 independent experiments/mice. Differences in the EC50 and/or maximum of the fitted non-linear regression curves were tested using an extra sum of squares F-test, and P, F and EC50 values are shown.

