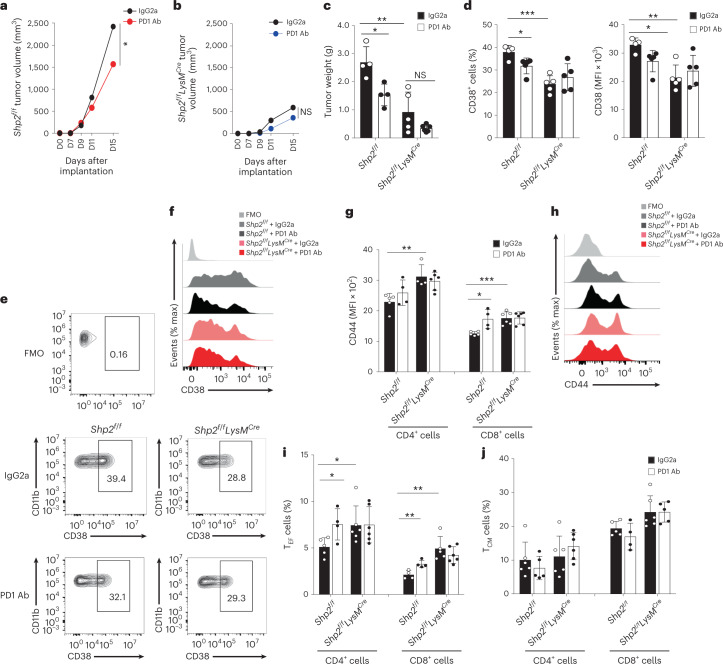
Fig. 2. PD-1 blockade induced antitumor responses in Shp2f/f mice but not in Shp2f/fLysMCre mice.
a–c, Tumor size in Shp2f/f (a) and Shp2f/fLysMCre mice (b) inoculated with B16-F10 melanoma (3 × 10⁵ cells per mouse) and treated with PD-1 blocking antibody or IgG2a control on days 9, 11 and 13 after tumor inoculation and measured starting on day 7 (a, b) or day 15 (c). Results show means + s.d. are representative of three experiments n = 4 mice per group and two experiments with n = 5 mice per group. d–f, Quantification (d) and representative flow cytometry (e, f) of CD38 expression in spleen PMN-MDSC isolated from mice as in a. g,h, Quantification (g) and representative histograms (h) of CD44 expression in CD4+ and CD8+ T cells of dLN. i,j, Frequency of CD4+ and CD8+ TEF cells (i) and CD4+ and CD8+ TCM-like cells (j) in dLN on Shp2f/f versus Shp2f/fLysMCre mice treated with IgG2a or PD-1 Ab mean percentage ± s.d. are shown. Results are from one of three separate experiments with five mice per group. *P = 0.017–0.028, **P = 0.0047–0.0075, ***P = 0.0006, unpaired two-sided t test.

