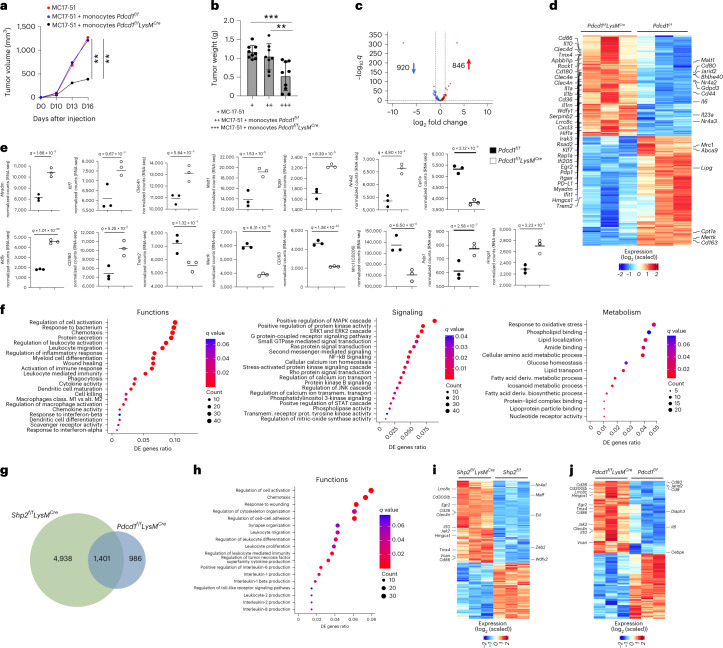
Fig. 8. PD-1 deletion altered signaling and metabolism, and imprinted an effector function program in TAMs.
a,b, Tumor size in naïve WT mice subcutaneously injected with MC17-51 tumor cells with or without CD45+CD11b+Ly6ChiLy6G− monocytes isolated from the bone marrow of Pdcd1f/fLysMCre and Pdcd1f/f mice on day 9 post inoculation of MC17-51 tumors. b, Tumor weight on day 15 in mice as in a. Results show mean + s.d. Results are from one of two experiments with n = 10 mice per group. **P = 0.0055–0.0079, ***P = 0.0006, ANOVA. c,d, Volcano plot of DE genes (c) and heat map (d) of 1,766 genes differentially expressed in TAMs isolated from MC17-51 tumor-bearing Pdcd1f/f and Pdcd1f/fLysMCre mice and analyzed by RNA-seq. log2(FC) > 0 and log2(FC) < 0 for upregulated and downregulated genes, q < 0.05 for all DEGs, respectively). e, Expression of the indicated genes in TAMs from Pdcd1f/f and Pdcd1f/fLysMCre tumor-bearing mice (data from RNA-seq dataset). f. Bubble plot of substantially enriched functional, signaling and metabolic pathways (q < 0.1) among the top 500 DE genes in TAMs of Pdcd1f/fLysMCre mice compared to Pdcd1f/f mice sorted by GeneRatio. g, Venn Diagrams depicting the overlap of substantially enriched pathways between upregulated DE genes in Shp2f/fLysMCre and Pdcd1f/fLysMCre TAMs. h, Bubble plot of common pathways enriched in among the top 500 DE genes in Shp2f/fLysMCre and Pdcd1f/fLysMCre TAMs. i,j, Heat maps of the top 6,500 DE genes in TAMs of tumor-bearing Shp2f/fLysMCre mice (i) and heat maps of the top 1,766 DE genes in TAMs of Pdcd1f/fLysMCre mice (j). Representative common (left) and distinct (right) IRF8-upregulated genes are annotated.

