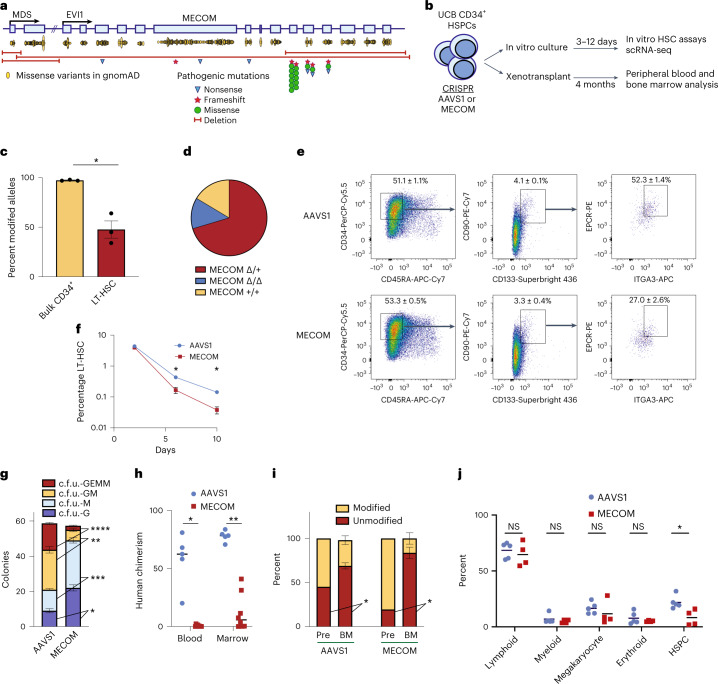
Fig. 1. Generating a faithful model of MECOM haploinsufficiency and HSC loss.
a, Schematic of the MECOM locus displaying two coding exons of MDS (MDS 2–3) and 15 coding exons of EVI1 (EVI1 2–16). Yellow ovals represent frequency and location of missense variants from individuals in the gnomAD database. Pathogenic variants from patients with bone marrow failure include nonsense (blue triangles), frameshift (red stars) and missense mutations (green circles) as well as large deletions (red bars). b, Experimental outline of MECOM editing and downstream analysis in human UCB-derived HSCs. c, Bar graph of the frequency of modified MECOM alleles in bulk CD34+ human HSPCs or in LT-HSCs. HSPCs that underwent CRISPR editing were cultured in HSC medium containing UM171. On day 6 after editing, genotyping by PCR and Sanger sequencing was performed on bulk HSPCs or LT-HSCs sorted by fluorescence-activated cell sorting (FACS). Mean of three independent experiments is plotted and error bars show s.e.m. Two-sided Student’s t-test was used. *P = 0.0048. d, Pie chart showing the proportion of MECOM genotypes in single-cell LT-HSCs following MECOM perturbation. Overall, 189 single-cell LT-HSCs were genotyped using single-cell genomic DNA sequencing and classified as either wild-type (MECOM+/+, yellow), heterozygous edited (MECOMΔ/+, red) or homozygous edited (MECOMΔ/Δ, blue). e,f, Phenotypic analysis of LT-HSCs after MECOM editing. e, Gating strategy to identify phenotypic LT-HSCs after CRISPR editing of AAVS1 or MECOM. LT-HSCs are defined as CD34+CD45RA-CD90+CD133+EPCR+ITGA3+. Mean (± s.e.m.) in the highlighted gates on day 6 after CRISPR editing is shown (n = 3) and the total LT-HSC percentage is the product of the frequencies in each gate shown. f, Time course showing that MECOM editing leads to progressive loss of phenotypic LT-HSCs in vitro. The x axis displays days after CRISPR editing and the y axis displays the percent of live cells in the LT-HSC gate as defined above. Mean of three independent experiments is plotted and error bars show s.e.m. Error bars that are shorter than the size of the symbol in the AAVS1 samples have been omitted for clarity. Two-sided Student’s t-test was used. *P = 0.003. g, Stacked bar plots of colony-forming assay comparing MECOM-edited UCB-derived CD34+ HSPCs (n = 3) to AAVS1-edited controls (n = 3). Three days after CRISPR perturbation, cells were plated in methylcellulose and colonies were counted after 14 d. MECOM editing leads to reduced formation of multipotent c.f.u. GEMM and bipotent c.f.u. GM progenitor colonies and an increase in unipotent colonies. Mean colony number is plotted and error bars show s.e.m. Two-sided Student’s t-test was used. *P = 3.3 × 10⁻³, **P = 1.4 × 10⁻³, ***P = 7.8 × 10⁻⁴, ****P = 4.5 × 10⁻⁵. h, Analysis of peripheral blood and bone marrow of mice at week 16 following xenotransplantation of MECOM-edited (n = 8) and AAVS1-edited (n = 5) HSPCs. Mean is indicated by black line and each data point represents one mouse. Two-sided Student’s t-test was used. *P = 5 × 10⁻⁶, **P = 2 × 10⁻⁶. i, Comparison of edited allele frequency following xenotransplantation. MECOM-edited cells in bone marrow after xenotransplantation are enriched for unmodified alleles as detected by next-generation sequencing (NGS), revealing a selective engraftment disadvantage of HSPCs with MECOM edits. Pre, pre-transplant; BM, bone marrow. Mice with human chimerism >2% are included in this analysis (AAVS1, 5 of 5 mice; MECOM, 4 of 8 mice) Mean is plotted and error bars show s.e.m. Two-sided Student’s t-test was used. *P = 0.02. j, Subpopulation analysis of human cells in mouse BM after xenotransplantation. Cell populations were identified by the following surface markers: lymphoid, CD45+CD19+; myeloid, CD45+CD11b+; megakaryocyte, CD45+CD41a+; erythroid, CD235a+; and HSPC, CD34+. Only mice with human chimerism >2% were included in the analysis (AAVS1, 5 of 5 mice; MECOM, 4 of 8 mice). Mean is indicated by black lines and each data point represents one mouse. Two-sided Student’s t-test was used. NS, not significant, *P = 0.01.

