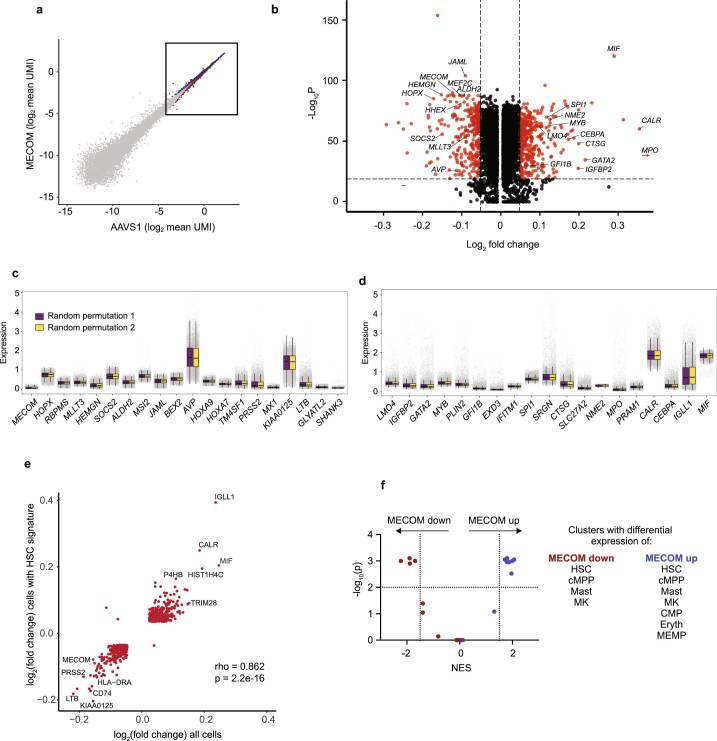
Extended Data Fig. 3. Characterization of the MECOM network in LT-HSCs.
(a) Scatter plot of gene expression in LT-HSCs following AAVS1 or MECOM editing showing the expression of all genes. The inset box highlights the subset of genes described in Fig. 3a that contains the differentially expressed genes that make up the MECOM regulatory network. (b) Volcano plot projection of the data from Fig. 3a displaying the small but significant fold changes in gene expression of MECOM down genes (log2 fold change < −0.05) and MECOM up genes (log2 fold change > 0.05) with p-value <1e-20 as determined by Mann-Whitney U test. Log2fold change of MPO expression is out of scale of the axis and is noted by a red arrow. (c-d) Box plots showing expression of a subset of MECOM down (c) and MECOM up (d) genes in a representative random permutation of cohort assignments, demonstrating no difference in gene expression. Gray dots show imputed gene expression in single cells. n = 1,000 randomly assigned cells in each group. The box plot center line, limits, and whiskers represent the median, quartiles, and interquartile range, respectively. (e) Scatter plot of gene expression in CD34+CD45RA−CD90+CD133+EPCR+ITGA3+ LT-HSCs enriched for the HSC signature compared to bulk LT-HSCs. Expression differences between MECOM and AAVS1-edited LT-HSCs were calculated and MECOM down and MECOM up genes are plotted. Correlation was calculated using Spearman’s rank correlation test and significance was calculated using permutation testing. (f) Scatter plot of enrichment scores of MECOM down and MECOM up gene sets in hematopoietic progenitors. CD34+CD45RA−CD90+ HSCs from Fig. 2b were clustered by cell identities as in Fig. 2a. Differences in gene expression between AAVS1 and MECOM edited samples in each cluster were calculated and used to query for the enrichment of MECOM down (red) or MECOM up (blue) gene sets by GSEA. X-axis plots the Normalized Enrichment Score (NES) and y-axis plots -log10(p-value) for each cluster as calculated by Kolmogorov Smirnov (K-S) test. Significant enrichment was defined as NES > 1.5 or < −1.5 and pval <0.01.

