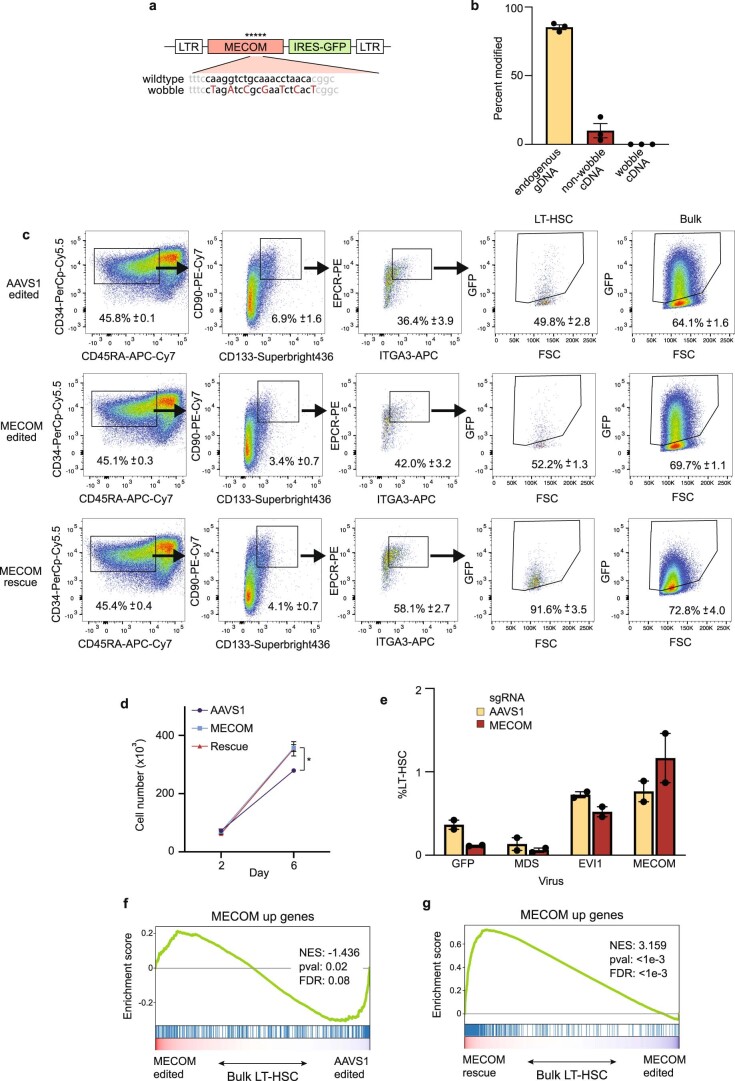
Extended Data Fig. 4. Lentiviral expression of MECOM rescues LT-HSCs but does not reverse upregulation of MECOM up genes.
(a) Schematic of lentiviral vector for increased MECOM expression. MECOM sgRNA binding site is shown in bold, and wobble mutations introduced by PCR are indicated. LTR, long terminal repeat; IRES, internal ribosome entry site. (b) Edited allele frequency of intended endogenous MECOM locus and MECOM cDNA after viral integration. Editing and infection were performed as in Fig. 4a. Integrated viral cDNA was amplified using a forward primer in the cDNA sequence and reverse primer in the IRES sequence. n = 3 biologically independent samples. Mean is plotted and error bars show s.e.m. (c) FACS plots for LT-HSC detection after MECOM editing and rescue. Gating strategy as in Fig. 1e. Percentages show the mean (± s.e.m) of three independent experiments. GFP ratio (Fig. 4e) is defined as the ratio of GFP+ cells in LT-HSC population (column 4) to GFP+ cells in the bulk population (column 5). (d) Cell expansion after MECOM editing and rescue. Increased expansion of HSPCs after MECOM editing is not reversed by viral MECOM expression. AAVS1, edited at AAVS1, infected with GFP virus; MECOM, edited at MECOM, infected with GFP virus; rescue, edited at MECOM, infected with MECOM virus, n = 3 for each group. Mean is plotted and error bars show s.e.m. Two-sided Student t-test used. *P = 3.7e-3. (e) Bar graph of the effect of MECOM isoform overexpression on the maintenance of LT-HSCs. HSPCs were edited at AAVS1 (yellow) or MECOM (red) and infected with lentivirus encoding GFP or MECOM isoforms as displayed. The percentage of LT-HSCs was determined by FACS. n = 2 biologically independent sample. Mean is plotted and error bars show s.e.m. (f-g) GSEA of MECOM up genes after editing and rescue in bulk LT-HSCs. (f) MECOM up genes are more highly enriched in AAVS1 samples in bulk in contrast to data from single cell analysis (Fig. 3a). (g) MECOM up genes are further increased after MECOM viral infection. The Kolmogorov Smirnov (K-S) test was used to determine the significance of GSEA.

