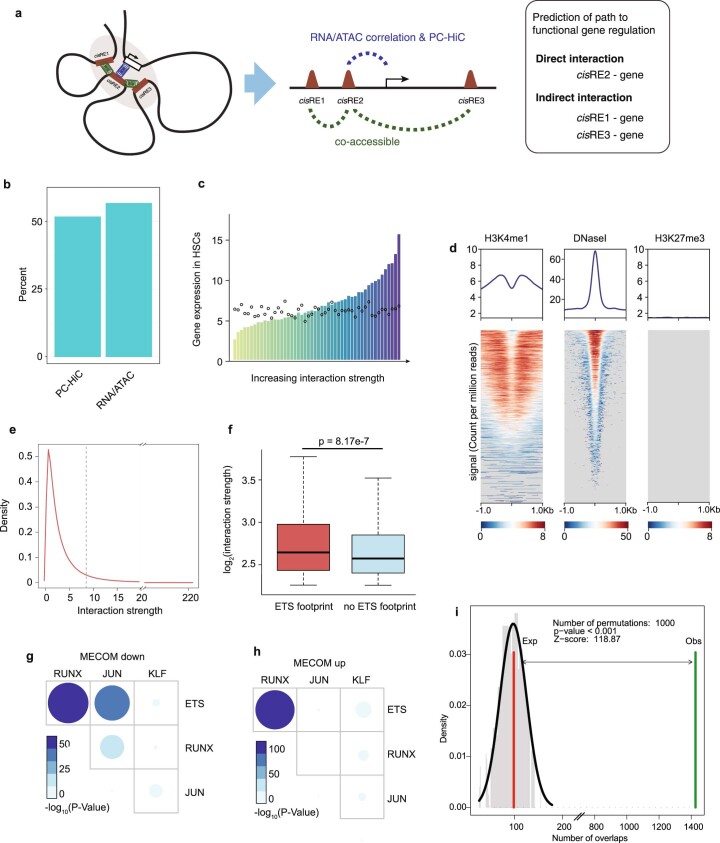
Extended Data Fig. 5. Establishment of a cis-regulatory network in HSCs.
(a) Schematic view demonstrating different types of functional interactions between cis-regulatory elements and genes. HemeMap predicts these interactions by integration of multiomics data including RNAseq, ATACseq and promoter capture-HiC (PC-HiC) data across 16 or 18 hematopoietic cell types. (b) Bar graph showing the overlap between genomic interactions nominated by HemeMap and experimentally defined interactions. More than half of the direct interactions nominated by PC-HiC and RNA−ATAC correlations were supported by evidence from Hi-C interactions in HSPCs. (c) Correlation of cisRE-gene interaction strength with gene expression in HSCs. HemeMap scores were calculated for each cisREs-gene interaction and HemeMap interactions were arranged by increasing scores and grouped evenly into 50 bins. Median gene expression in each bin is depicted (bars). The median expression of a randomly sampled equal-sized gene set is shown (dots). (d) Validation of cisREs associated with MECOM network genes. H3K4 methylation, DNase hypersensitivity and H3K27 trimethylation signals from HSPCs52 at MECOM network cisREs reveals an active transcriptional pattern consistent with enhancer elements. (e) Distribution of HemeMap scores in HSCs. To construct the HSC-specific regulatory network, significant interaction scores >8.91 were included. Significance threshold was determined by Chi-square distribution. (f) Comparison of interaction strengths. cisREs containing ETS footprint (n = 711) were significantly associated with stronger HemeMap scores than those without (n = 6,371). P-values as shown were calculated using a two-sided Wilcoxson signed-rank test. The box plot center line, limits, and whiskers represent the median, quartiles and 1.5x interquartile range, respectively. (g-h) Analysis of TF footprint co-occurrence in the cisREs associated with MECOM down genes (g) and MECOM up genes (h), respectively. The frequency of occurrence and P values were calculated using a two-sided hypergeometric test. The color and size of dots are proportional to statistical significance. (i) Experimentally defined EVI1 ChIP-seq peaks26 were compared to HemeMap predicted cisREs of MECOM network genes and show significant overlap with cisREs that contain ETS footprints. P-value was determined by permutation testing.

