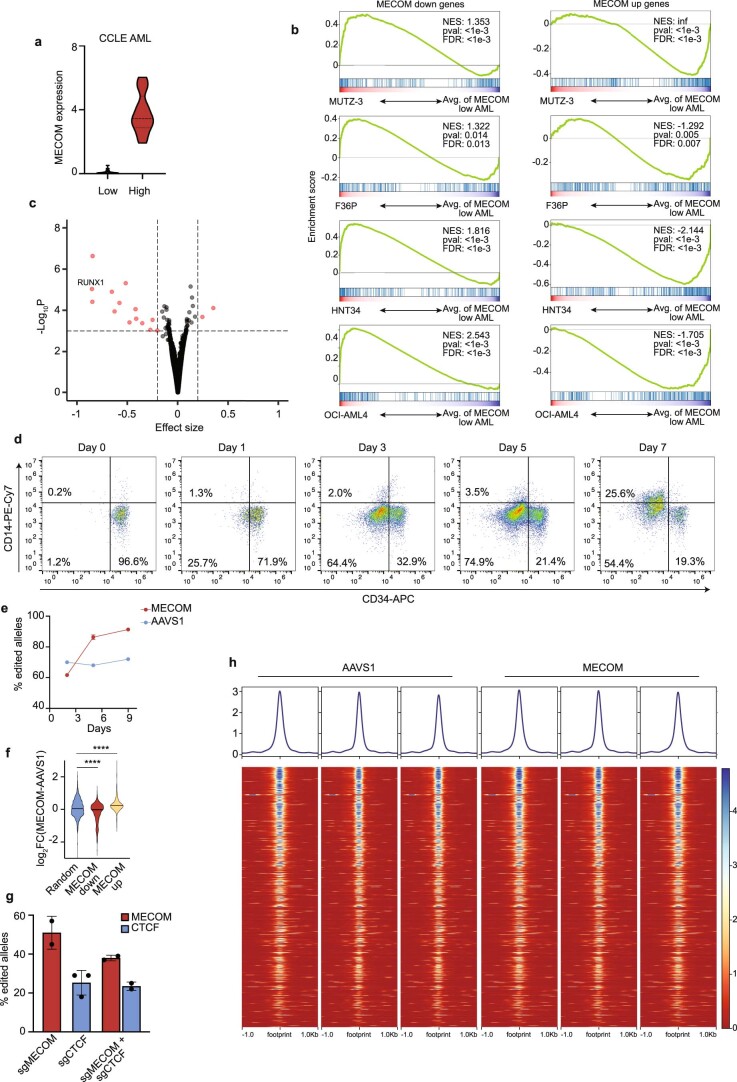
Extended Data Fig. 8. Evaluation of the MECOM gene network in high-risk AML.
(a) Violin plots showing MECOM expression in AML samples from CCLE. AML samples were stratified by MECOM expression (log2 RPKM + 1). Low, <1 (n = 31); High≥1 (n = 13). Mean is plotted and dashed lines indicate quartiles. (b) GSEA of MECOM down genes and MECOM up genes in four AML cell lines with high MECOM expression compared to average expression in MECOM low AML cell lines. MUTZ-3, F36P, HNT34, and OCI-AML4 have enrichment of MECOM down genes and depletion of MECOM up genes. The Kolmogorov Smirnov (K-S) test was used to determine the significance of GSEA. (c) Volcano plot showing differential CRISPR dependencies of CCLE AMLs stratified by MECOM expression. Average CRISPR dependencies for the CCLE AML cohorts as defined in Extended Data Fig. 8a were determined using CERES and effect size was calculated by comparing dependency scores of MECOM high and MECOM low AMLs. Effect size of 0 indicates no difference in essentiality whereas negative effect size indicates higher essentially in MECOM high AML. Significance was calculated with Mann-Whitney U test. (d) FACS plots showing the differentiation of MUTZ-3 cells after CD34 selection. CD34+ MUTZ-3 cells were magnetically separated using the EasySep Human CD34 Positive Selection Kit II, cultured in MUTZ-3 media, and analyzed by flow cytometry at the indicated timepoints. (e) Time course of edited allele frequency in MUTZ-3 AML. Genotyping was performed in bulk MUTZ-3 cells following CRISPR editing at AAVS1 (blue) or MECOM (red). n = 3 biologically independent samples. Mean is plotted and error bars show s.e.m. Missing error bars are obscured by the icons. (f) Violin plot of differential gene expression in CD34+ MUTZ-3 cells following MECOM perturbation. MECOM down genes are significantly depleted and MECOM up genes are significantly enriched in MECOM edited samples compared to AAVS1 edited samples, unlike a set of randomly selected genes. Two-sided Student t-test used. ****P = 1e-4. (g) Bar graphs of CRISPR editing frequencies in MUTZ-3 AML. Cells that underwent dual CRISPR perturbation of MECOM and CTCF had similar editing frequencies compared to single-edited cells. n = 2 biologically independent samples. Mean is plotted and error bars show s.e.m. (h) CTCF ChIP-seq in MUTZ3 cells after MECOM editing. MUTZ-3-Cas9 cells were transduced with sgMECOM lentivirus and cells were harvested on day 4 for ChIP-seq. There is significant CTCF binding to cisREs of MECOM down genes in MUTZ-3, but no differential binding after MECOM editing.

