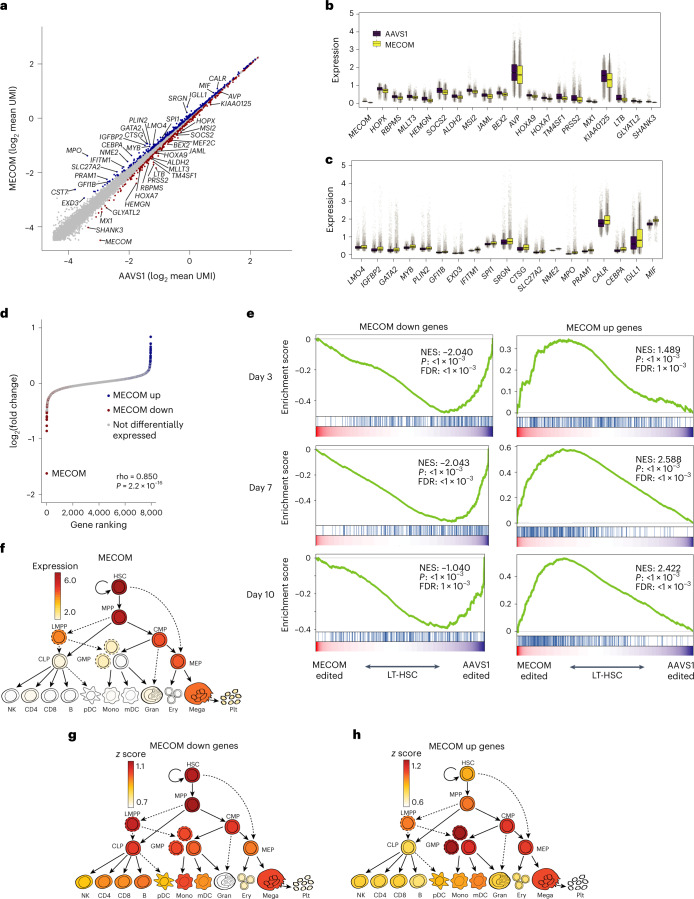
Fig. 3. Delineation of a MECOM regulatory network in LT-HSCs.
a, Scatter-plot of gene expression in LT-HSCs following AAVS1 or MECOM editing. Single-cell expression data for each gene was averaged following imputation and the subset of genes with highest expression is plotted. Differential gene expression was determined using Seurat 4.0 differential expression analysis with the MAST pipeline and is indicated by colored dots, MECOM down genes, red; MECOM up genes, blue. A gene is defined as differentially expressed if log2 fold change >0.05 and adjusted P < 1 × 10⁻²⁰ as determined by MAST. b,c, Box plots showing expression of a subset of MECOM down (b) and MECOM up (c) genes after MECOM editing. Gray dots show imputed gene expression in single cells; n = 4,291 single cells in the AAVS1-edited group and 5,935 cells in the MECOM-edited group. The box plot center line, limits and whiskers represent the median, quartiles and interquartile range, respectively. d, Pseudobulk analysis of differentially expressed genes. Transcriptomic data from single LT-HSCs that had undergone AAVS1 or MECOM perturbation were integrated to generate pseudobulk gene expression profiles. Expression differences between the AAVS1 and MECOM pseudobulk samples are plotted in rank order and differentially expressed genes from the scRNA-seq analysis are highlighted (MECOM down genes, red; MECOM up genes, blue). Correlation of differential gene expression between pseudobulk and single-cell analyses was calculated using Spearman’s rank correlation and significance was calculated using permutation testing. e, GSEA plots showing the depletion of MECOM down genes and the enrichment of MECOM up genes in LT-HSCs at three time points in culture after MECOM editing. UCB CD34+ cells underwent CRISPR editing and were kept in HSC medium with UM171 for the indicated time. The Kolmogorov–Smirnov (K–S) test was used to determine the significance of GSEA. f–h, Expression of MECOM (log2 normalized counts per million mapped reads) throughout hematopoietic differentiation reveals robust expression in HSCs (f), similar to the enrichment of expression of MECOM down genes (g) and the inverse of the expression pattern of MECOM up genes (h).

