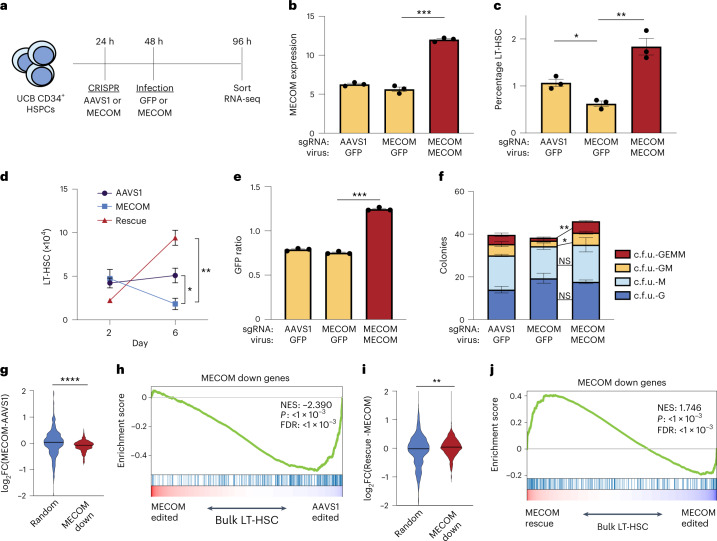
Fig. 4. MECOM rescue of functional and transcriptional changes in HSCs.
a, Experimental outline of MECOM editing and rescue. b–d, Effects of MECOM editing and infection with MECOM or GFP lentivirus. MECOM expression (RPKM) measured by RNA-seq is shown (b). Percent of LT-HSC determined by FACS (c) and number of LT-HSCs are shown (d); n = 3 per group. Mean is plotted and error bars show s.e.m. Two-sided Student’s t-test was used. *P = 1.1 × 10⁻², **P = 6.7 × 10⁻³, ***P = 1 × 10⁻⁴. e, GFP ratio following lentiviral infection. GFP ratio is defined as percent of GFP+ LT-HSCs divided by the percent GFP+ bulk HSPCs. GFP ratio >1 is consistent with enrichment of infected cells in the LT-HSC population; n = 3 per group. Mean is plotted and error bars show s.e.m. Two-sided Student’s t-test was used. ***P = 1.5 × 10⁻⁴. f, Stacked bar plots of colony-forming assay. Infection with MECOM virus leads to restoration of multipotent c.f.u. GEMM and bipotent c.f.u. GM colonies that are lost following MECOM editing; n = 3 per group. Mean colony number is plotted and error bars show s.e.m. Two-sided Student’s t-test was used. *P = 3.3 × 10⁻², **P = 1.1 × 10⁻³. g, Violin plot of differential gene expression in bulk LT-HSCs following MECOM perturbation. MECOM down genes are significantly depleted in MECOM-edited samples compared to AAVS1-edited samples, unlike a set of randomly selected genes. Two-sided Student’s t-test was used. **** P = 1 × 10⁻⁴. h, GSEA of MECOM down genes after MECOM perturbation. MECOM down genes that were identified from scRNA-seq analysis are depleted in MECOM-edited LT-HSCs in bulk, compared to AAVS1-edited cells. The K–S test was used to determine the significance of GSEA. i, Violin plot of differential gene expression in bulk LT-HSCs following MECOM perturbation and rescue. MECOM down genes are significantly enriched in MECOM rescue samples compared to MECOM-edited samples, unlike a set of randomly selected genes. Two-sided Student’s t-test was used. **P = 4.7 × 10⁻³. j, GSEA of MECOM down genes after MECOM perturbation and rescue. MECOM down genes that were identified from the scRNA-seq analysis are enriched in MECOM rescued LT-HSCs in bulk, compared to MECOM-edited cells. The K–S test was used to determine the significance of GSEA.

