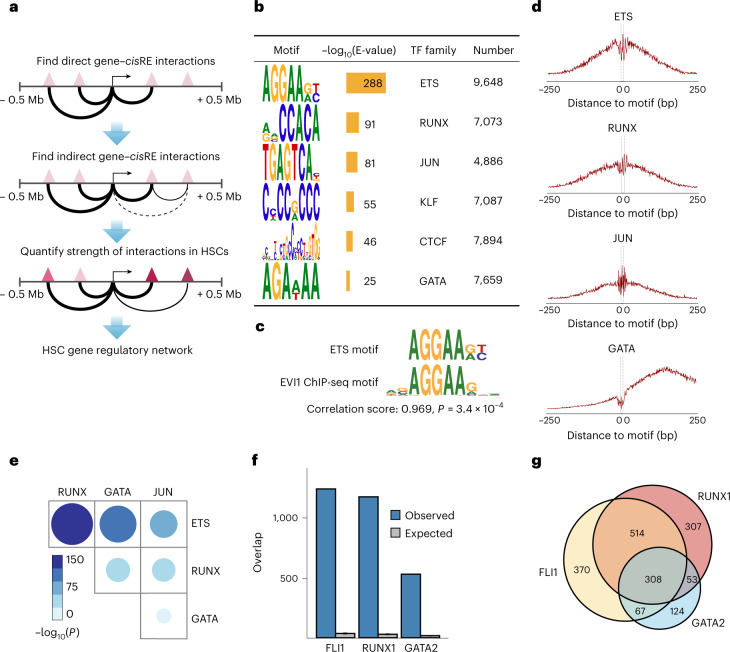
Fig. 5. Defining the HSC cis-regulatory network coordinated by MECOM.
a, Schematic of the HemeMap method used to define an HSC-specific regulatory network. b, Significantly enriched conserved motifs associated with cisREs of MECOM network genes in the HSC-specific regulatory network and the number of instances of each motif are shown. Motif discovery and significance testing were performed using MEME. c, Motif similarity between the ETS motif and a previously identified EVI1 motif from ChIP-seq13. Similarity was determined by the Pearson correlation coefficient of the position frequency matrix in a comparison of the two motifs and significance was determined using permutation test. d, Footprinting analysis of ETS, RUNX, JUN and GATA within the cisREs in the MECOM regulation network. The plots show Tn5 enzyme cleavage probability of each base flanking (±250 bp) and within TF motifs in HSCs. e, Analysis of TF footprint co-occurrence in the MECOM network. The frequency of occurrence of each footprint in MECOM network cisREs was computed and the P value of co-occurrence for each TF pair was determined by a two-sided hypergeometric test. The color and size of dots are proportional to statistical significance. f, Specific TF occupancy of cisREs in the MECOM network in CD34+ HSPCs. The number of cisREs associated with the MECOM network that overlap with ChIP-seq peaks for FLI1, RUNX1 and GATA2 were determined. For each TF, the expected distribution of overlapping cisREs was generated by 1,000 permutations of an equal number of TF peaks across the genome. Mean is plotted and error bars show s.d. g, Overlap of TF occupancy in MECOM network cisREs. The number of cisREs that contain ChIP-seq peaks for FLI1 (yellow), RUNX1 (red), GATA2 (blue) or combinations of TFs are indicated.

