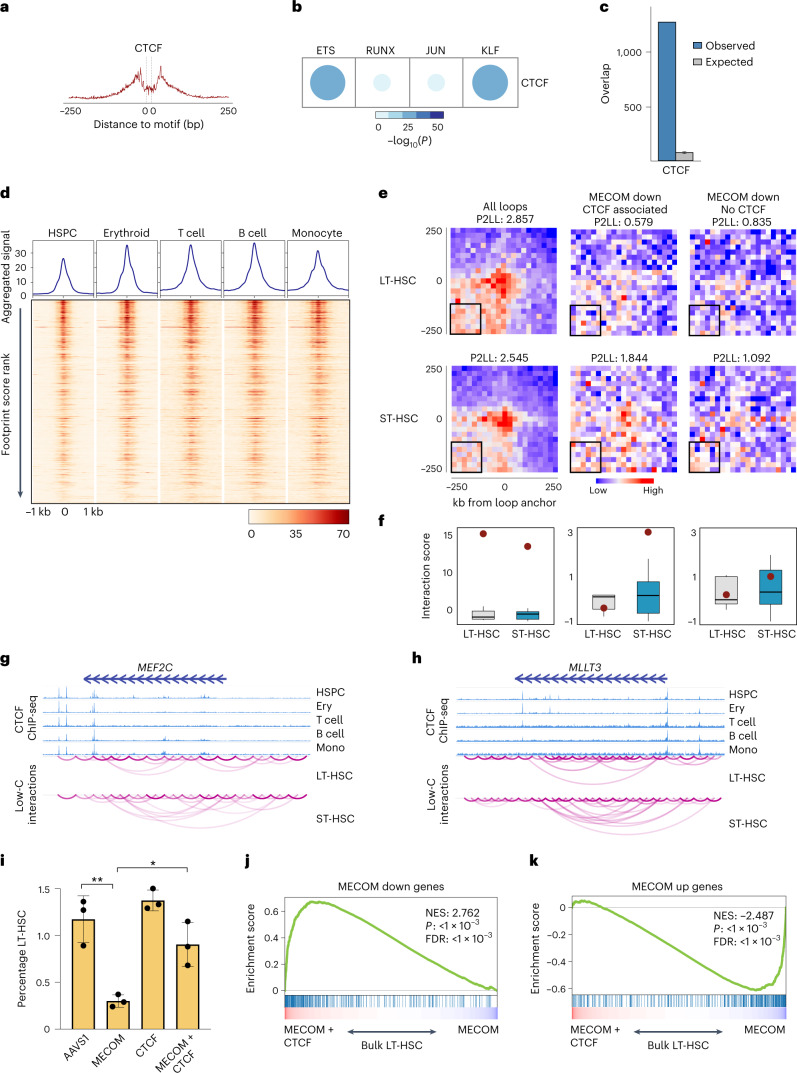
Fig. 6. Dynamic CTCF binding facilitates repression of MECOM down genes as HSCs undergo differentiation.
a, Footprinting analysis of CTCF within the cisREs in the MECOM gene network. The plot shows Tn5 enzyme cleavage probability for each base flanking (±250 bp) and within the CTCF motif. b, Analysis of TF footprint co-occurrence of CTCF and other TFs in cisREs associated with MECOM down genes. The frequency of occurrence and P values were calculated using a two-sided hypergeometric test. The color and size of dots are proportional to statistical significance. c, CTCF occupancy of cisREs in MECOM down genes in CD34+ HSPCs. The number of cisREs associated with MECOM down genes that overlap with CTCF ChIP-seq peaks was determined and plotted as in Fig. 5f. The expected distribution of overlapping cisREs was generated by 1,000 permutations of an equal number of TF peaks across the genome. Mean is plotted and error bars show s.d. d, CTCF binding to MECOM down cisREs in hematopoietic lineages. Heat maps (bottom) show the CTCF ChIP-seq signals that overlap CTCF footprints in MECOM down cisREs in HSPCs, erythroid cells, T cells, B cells and monocytes. Each row represents a footprint ±1 kb of flanking regions and the rows are sorted by the posterior probability of footprint occupancy from high to low. The enrichment of CTCF binding to cisREs was calculated and displayed in the line graph (top). e, Aggregate peak analysis for the enrichment of chromatin loops in LT-HSCs (top) and ST-HSCs (bottom) using Low-C data. Chromatin loop interactions were determined for all chromatin loops derived from Hi-C data in hematopoiesis (left), the subset of CTCF-associated loops of MECOM down genes (center) and the subset of non-CTCF-associated loops of MECOM down genes (right). Aggregate signals over 500 kb centered on loop anchors with 25-kb resolution were calculated and are shown. The peak to lower left ratio (P2LL) enrichment score was calculated by comparing the peak signal to the mean signal of bins highlighted in black box in the heat map and is shown in the title of each plot. f, Box plots showing the standard normalized distribution of interaction scores for the lower left corner highlighted in the heat map in e. Red dots indicate the peak value. The columns are as described in e. Two-sided Student’s t-test was used to compare box plots which revealed no significant differences in background signal. For each box, n = 36 interactions and the box plot center line, limits and whiskers represent the median, quartiles and 1.5× interquartile range, respectively. g,h, Genome browser views of CTCF occupancy and chromatin interaction at MEF2C (g) and MLLT3 (h) gene loci in LT-HSCs and ST-HSCs. i, Bar graphs of LT-HSC rescue by dual MECOM and CTCF perturbation. Human HSPCs underwent CRISPR editing with the sgRNA guides depicted on the x axis. Percent of LT-HSCs was determined by FACS on day 6; n = 3 per group. Mean is plotted and error bars show s.e.m. Two-sided Student’s t-test was used. *P = 1.3 × 10⁻², **P = 4.2 × 10⁻³. j,k, GSEA of MECOM down genes (j) and MECOM up genes (k) after dual MECOM and CTCF perturbation compared to MECOM perturbation alone. Bulk RNA-seq was performed in biological triplicate on day 5 after CRISPR perturbation. MECOM down genes are enriched and MECOM up genes are depleted following concurrent CTCF editing. The K–S test was used to determine the significance of GSEA.

