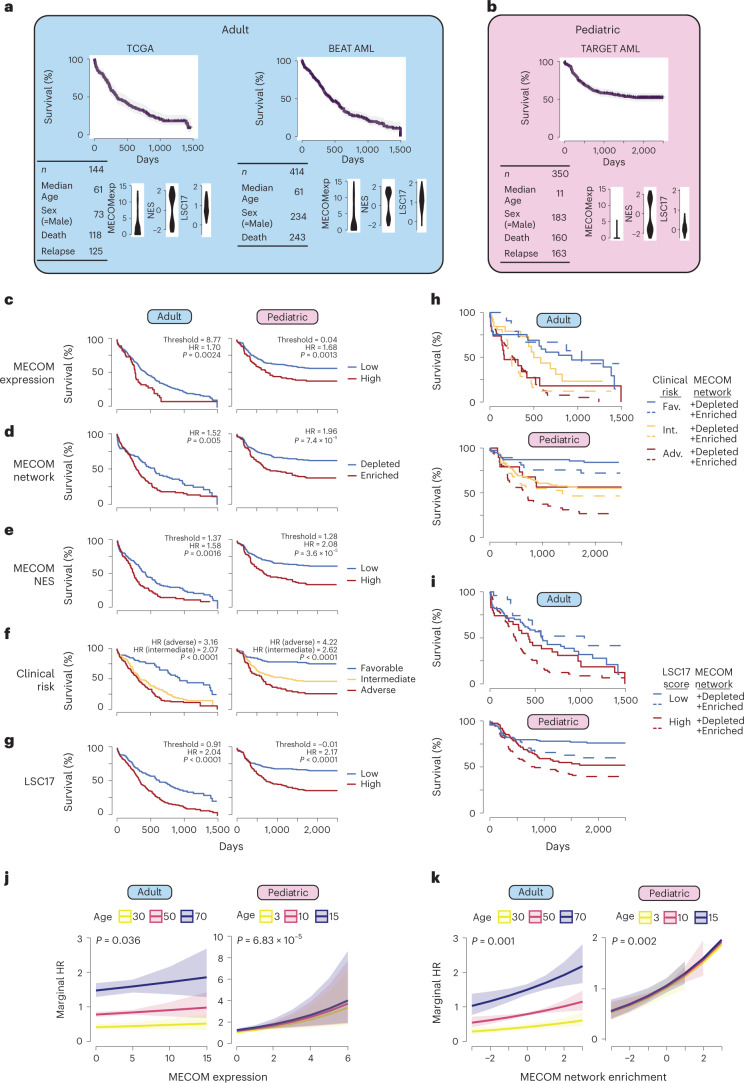
Fig. 7. The MECOM down gene network is hijacked in high-risk adult and pediatric AML.
a,b, Descriptive statistics for included clinical cohorts. After correcting for study, TCGA and BEAT data were integrated into an adult cohort (a). All of the pediatric data came from the TARGET database (b). Distribution of MECOM expression, MECOM NES and LSC17 score are displayed for each clinical dataset. c–g, Kaplan–Meier (KM) overall survival curves for adult and pediatric AML cohorts stratified by MECOM expression (c), MECOM network enrichment (d), MECOM NES (e), clinical risk group (f) and LSC17 (g). For continuous variables in c,e,g optimal threshold was determined by maximizing sensitivity and specificity on mortality (Youden’s J statistic). HRs were computed from univariate Cox proportional hazard models. P values representing the result of Mantel–Cox log-rank testing are displayed. Test for trend was performed for clinical risk group stratification (more than two groups). h,i, KM overall survival curves stratified by current prognostic tools and MECOM down network status. MECOM network enrichment was significantly associated with mortality independent of clinical risk group in adult (P = 0.005) and pediatric (P = 0.008) AML (h) and independent of LSC17 score in adult (P = 0.01) and pediatric (P = 0.01) AML (i). j,k, Marginal hazard of death associated with increasing MECOM expression (j) and MECOM network enrichment score (k), stratified by age. 95% confidence interval of death is shown in the shaded regions. P values representing the significance of MECOM expression and MECOM network enrichment on survival were calculated using two-sided multivariable Cox proportional hazards modeling, adjusted for age and sex.

