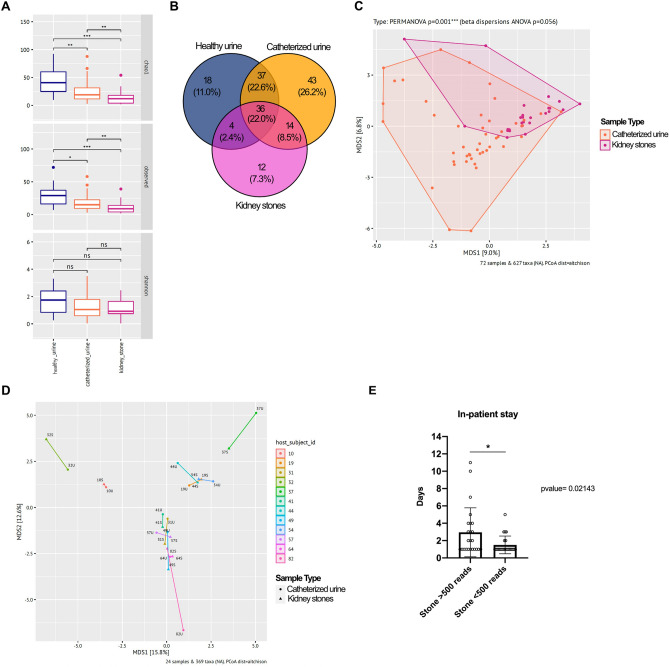
Fig. 2.
Microbiome analysis by sample type Alpha diversity calculated by Chao, observed and Shannon Index (A), Venn diagram of mutual and distinct genera per sample type (B). PCoA revealed significant difference between kidney stones and urine (p-value = 0.001***; C) but a close relation between individual pairs (D), highlighting the similarities of bacterial populations in stones (S) and respective urine (U). Patients with > 500 reads in stone material displayed a prolonged post-operative stay compared to patients with < 500 reads per stone (2.9 vs 1.5 days, p = 0.021*, E)

