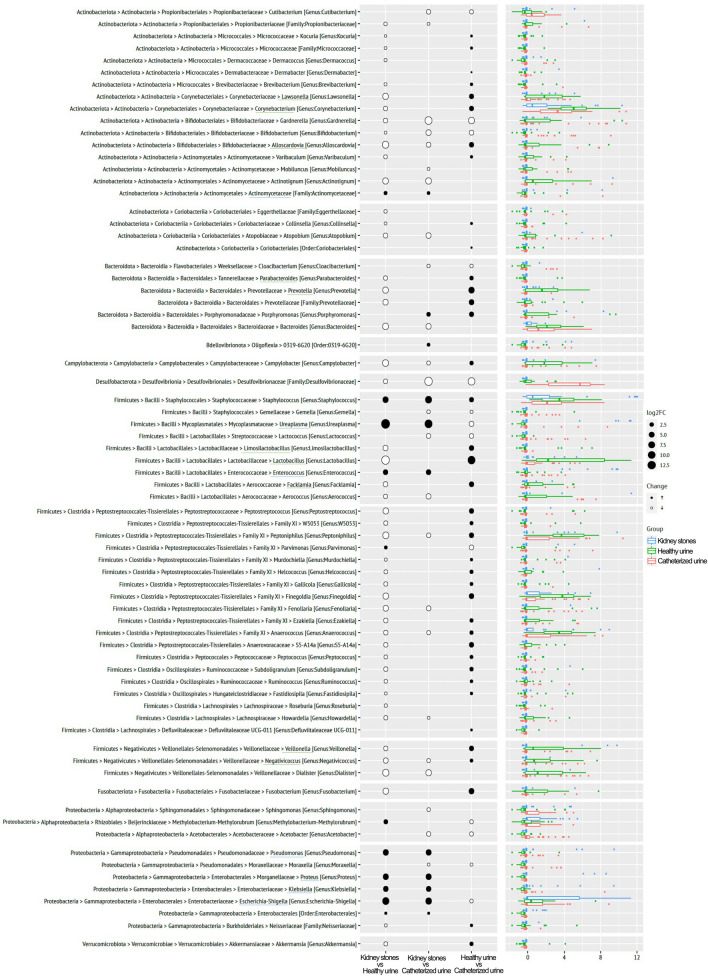
Fig. 3.
Differential relative abundance analysis by sample types Comparison of significantly deregulated genera per sample type. Black dots indicate increase, white a decrease of genus of the top compared to the bottom cohort, dot size illustrates the taxon abundance. Green underlined genera were predominantly found in healthy urine, blue underlined were significantly upregulated in kidney stones compared to catheterized or voided urine

