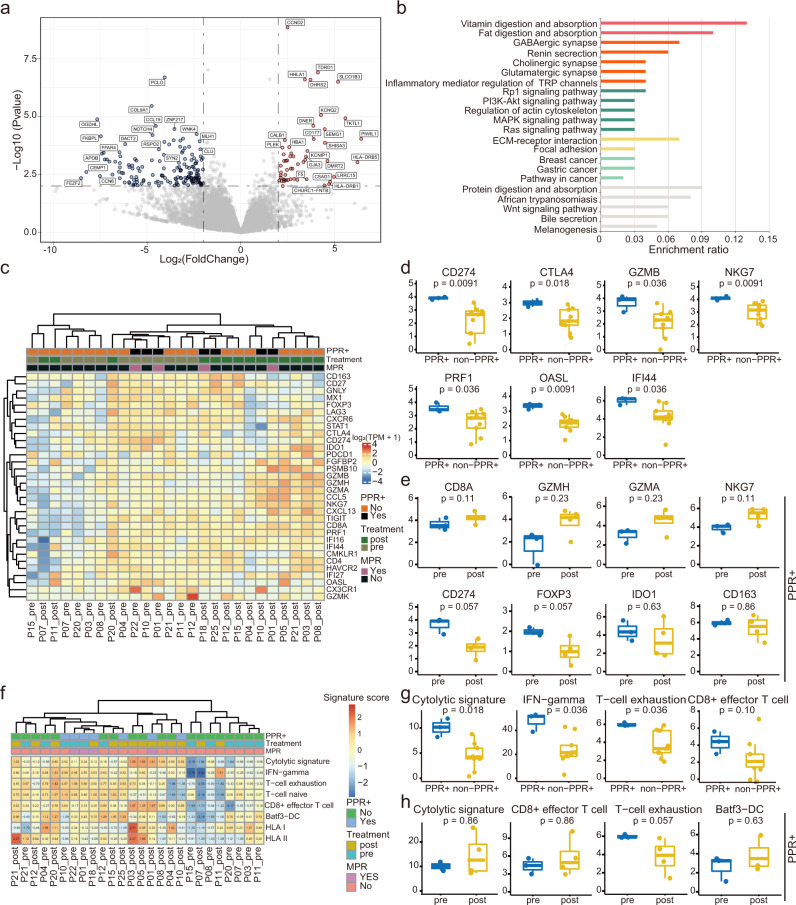
Fig. 4. Transcriptomic features in patients with different responses.
a Volcano plot showing differentially expressed genes between baseline MPR (n = 2) vs. non-MPR (n = 10) group. Color dots denote genes that passed the p-value and fold change thresholds. b Functional pathway enrichment by differential expressed genes at baseline. Similar pathways are clustered and stained with the same colors. c Heatmap for immune-related gene expression across samples in 15 patients. d Baseline levels of immune-related genes that were altered between PPR+ (n = 3) and non-PPR+ (n = 9) groups. e Level changes of immune-related genes between pre- (n = 3) and post-treatment (n = 4) PPR+ patients. f Heatmap for immune-related signatures across samples in 15 patients. g Baseline levels of immune-related signatures that were altered between PPR+ (n = 3) and non-PPR+ (n = 9) groups. h Changes in immune-related signatures between pre- (n = 3) and post-treatment (n = 4) patients. Centers, boxes, and whiskers indicate medians, quantiles, and minima/maxima, respectively, in d-e and g-h. Two-sided Wilcoxon rank-sum test was used for comparison in d-e and g-h. Source data are provided as a Source Data file.

