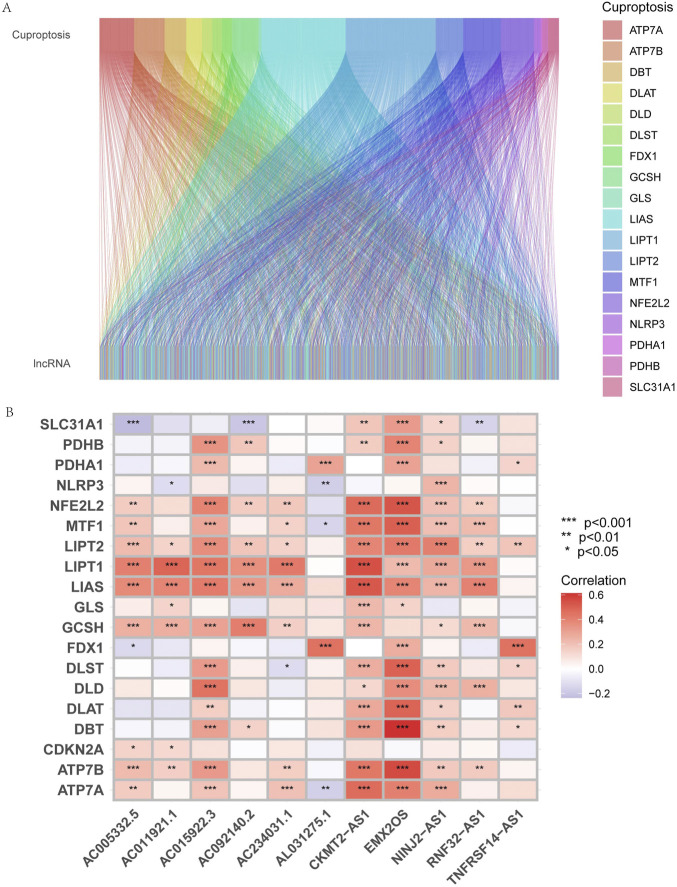
FIGURE 1.
Identification of cuproptosis-related lncRNAs and construction of prognosis signatures. (A) Sankey diagram showed the results of cuproptosis-related genes and cuproptosis-related lncRNAs co-expression. (B) The correlation heatmap showed the relationship between cuproptosis-related lncRNA signatures and cuproptosis-related genes. Red represents positive correlations, and blue represents negative correlations.

