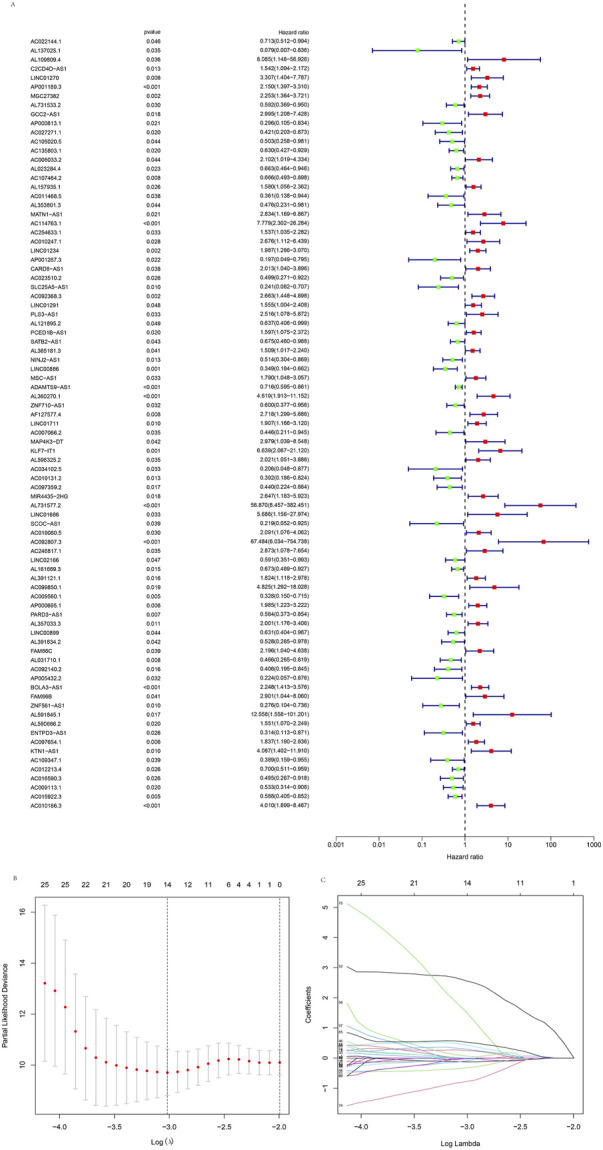
FIGURE 2.

Identification of the cuproptosis-related lncRNAs. (A) The forest plot showed different lncRNAs for high and low risk, with red representing high-risk lncRNAs and green representing low-risk lncRNAs. (B) Lasso regression screened cuproptosis-related lncRNAs at the minimum point of cross-validation. (C) The trajectory of each independent variable.
