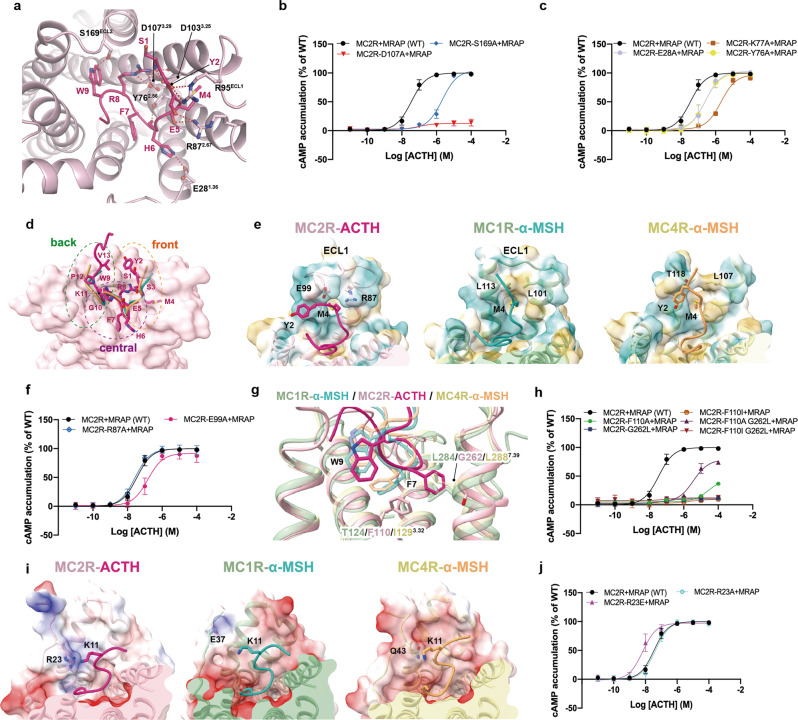
Fig. 3. Ligand recognition by the orthosteric LBP of MC2R.
a Detailed interactions between ACTH and MC2R. Polar interactions are presented by red dashed lines. b, c cAMP signaling of MC2R mutants in the LBP. d Front, central and back regions of MC2R LBP. MC2R surface is colored light pink; ACTH is colored deep pink; and α-MSH in active MC1R and MC4R structures are shown in forest green and orange, respectively. e Structural comparison among the front regions of the LBPs of MC2R, MC1R (PDB code: 7F4D), and MC4R (PDB code: 7F53). LBP surfaces are shown by the hydrophobicity. f cAMP responses of MC2R mutants in the front region. g Rotameric change of ACTH-F7 in the cavity of MC2R central region, compared to α-MSH-F7 in MC1R and MC4R (PDB codes: 7F4D, 7F53). h cAMP signaling of MC2R mutants in the central region. i Structural comparison among the back regions of the LBPs of MC2R, MC1R (PDB code: 7F4D), and MC4R (PDB code: 7F53). LBP surfaces are shown by the electrostatic potential. j cAMP signaling of MC2R mutants in the back region.

