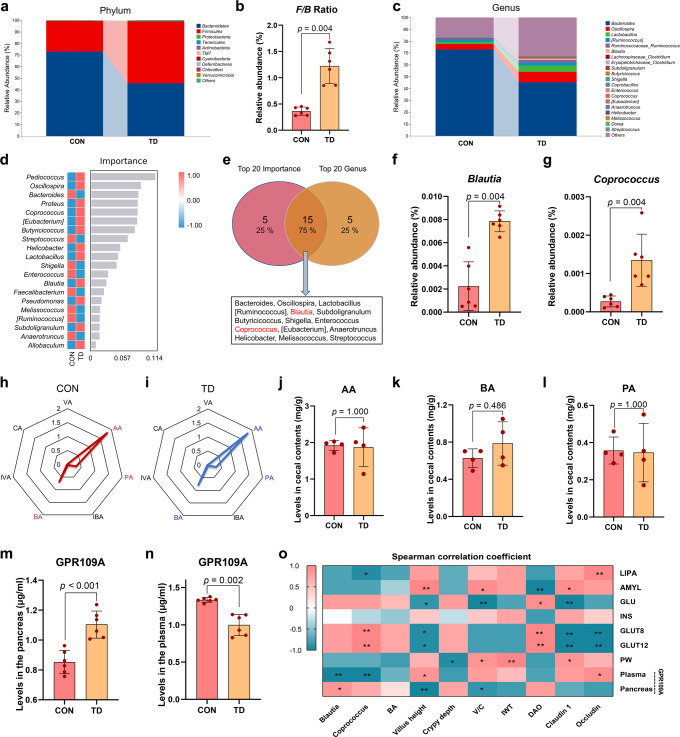
Fig. 4. Differences in GM abundance and SCFA levels in the TD and CON groups.
a The top ten phyla of the GM in terms of abundance. b Differential abundances of F/B ratios by phylum. c The top 20 most abundant GM components at the genus level. d Genus-level analysis of the GM using the random forest model. The abscissa indicates the importance of species to the classifier model, while the ordinate indicates the taxa name at the genus level. From top to bottom, the importance of species to the model decreases. e Venn diagrams of two sets of the top 20 species in terms of abundance and importance. f, g Differences in the abundances of GM components (Blautia and Coprococcus, respectively) at the genus level. h, i Radar chart showing the enrichment of seven SCFAs in the CON (red) and TD (blue) groups. Each corner represents an SCFA, and the length of the line from the centre to the corner represents the abundance of SCFAs. j–l The AA, BA, and PA levels in caecal contents. m, n GPR109A levels in the pancreas and plasma (n = 6 broilers per group). o Spearman’s analysis of the correlations between gut-related metrics and glucose-related parameters. Red, positive correlation. Blue, negative correlation. F/B firmicutes/bacteroidetes, AA acetic acid, BA butyric acid, CA caproic acid, IBA isobutyric acid, INS insulin, IVA isovaleric acid, VA valeric acid, GPR109A G-protein-coupled receptor 109A. A significant difference was defined as a p value less than 0.05 calculated using the Mann‒Whitney U test. The data are presented as the means ± SD.

