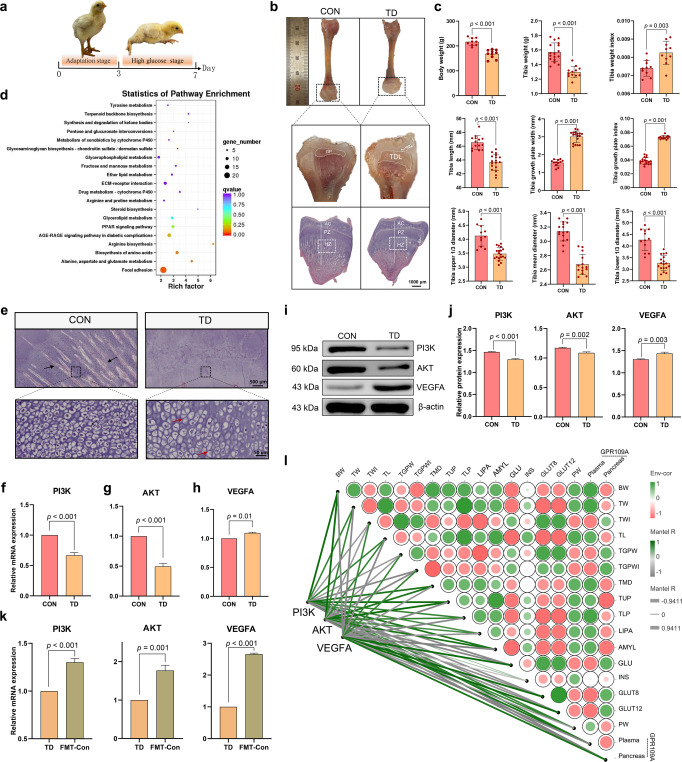
Fig. 7. Effects of PI3K, AKT and VEGFA expression on tibial growth in the TD and CON groups.
a Clinical characteristics of broiler chickens. b Morphological observation of the tibia and the HE staining of the TGPs (scale bars, 1000 µm). c Histogram showing body weight and tibia-related indicators. d Analysis of potential pathways based on DEGs in the tibia from the CON and TD groups of chickens. The bubble size indicates the number of DEGs enriched in this pathway, and points with different gradations of colour (from red to blue) represent the scope of the p value. e Representative images of HE-stained sections of TGPs. Black arrow, blood vessel. Red arrow, nuclear dissolution and nuclear pyknosis (scale bars: top, 500 µm; bottom, 50 µm). f–h The mRNA expression levels of PI3K, AKT and VEGFA in the TGPs (n = 3 broilers per group). I, j PI3K, AKT and VEGFA protein levels in the TGPs (n = 3 broilers per group). (k) The mRNA expression levels of PI3K, AKT and VEGFA in the TD and FMT-Con groups (n = 3 broilers per group). l The heatmap on the right shows the results of Spearman’s analysis of the correlations between GLU-related indicators and bone parameters. Green, positive correlation. Red, negative correlation. The heatmap on the left shows the results of Spearman’s analysis of the correlations of PI3K, AKT and VEGFA levels with glucose-bone indicators. Green, positive correlation. Grey, negative correlation. GP growth plate, TDL tibial dyschondroplasia lesion, AC articular cartilage, HZ hypertrophic zone, PZ proliferation zone, PI3K phosphatidylinositol-3-kinase, AKT protein kinase B, VEGFA vascular endothelial growth factor. A significant difference was defined as a p value less than 0.05 calculated using a two-tailed unpaired Student’s t test. The data are presented as means ± SD.

