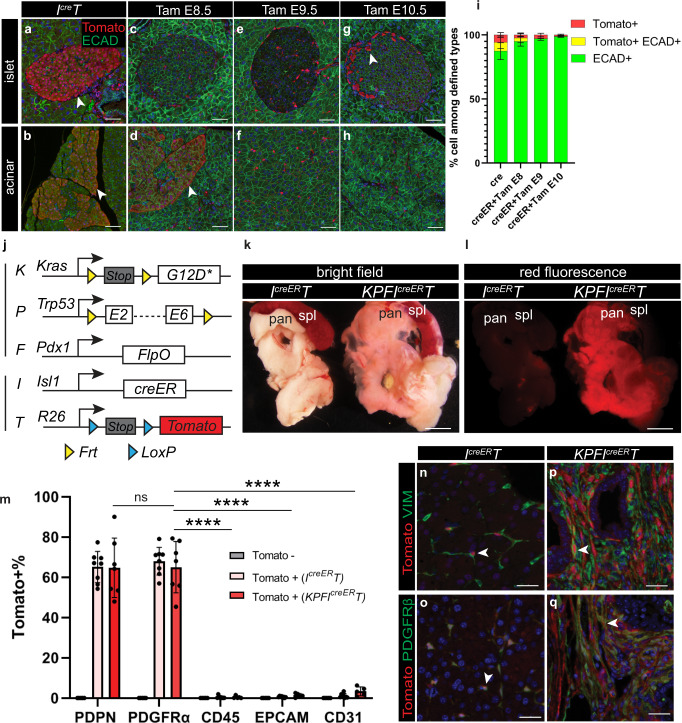
Fig. 4. KPFIcreERT model specifically targets fibroblasts in the pancreas.
a–h Co-immunostaining of pancreatic tissues (focusing on either the islet region or the acinar region) comparing the IcreT model and the IcreERT model treated with Tamoxifen at indicated times points. Arrowheads denote Tomato+ epithelial cells. i Quantification of cells that are either single positive or double positive for defined markers in images represented in (a–h). IcreT, n = 5 mice; IcreERT + Tam E8, n = 5 mice; IcreERT + Tam E9, n = 6 mice; IcreERT + Tam E10, n = 4 mice. j Schematic the KPFIcreERT mouse model. k, l Bright field and red epifluorescence views of dissected pancreata and spleens. IcreERT, n = 6 mice; KPFIcreERT, n = 7 mice. m Quantification of Tomato+ cells within PDPN+, PDGFRα+, CD45+, EpCAM+, or CD31+ cells identified by flow cytometry. Tomato-, n = 5 mice; IcreERT, n = 8 mice; KPFIcreERT, n = 7 mice. n–q Co-immunostaining of Tomato, VIM, and PDGFRβ on normal and PDAC pancreatic tissues. Arrowheads indicate double positive cells. Data are mean ± SD. Two-way ANOVA test with Tukey’s multiple comparisons was performed. **** indicates p < 0.0001; ns, not significant, p > 0.9999. Spl, spleen; pan, pancreas. Scale bars in a–h and n–q: 30 μm. Scale bars in k, l: 1000 μm. Source data are provided as a Source data file.

