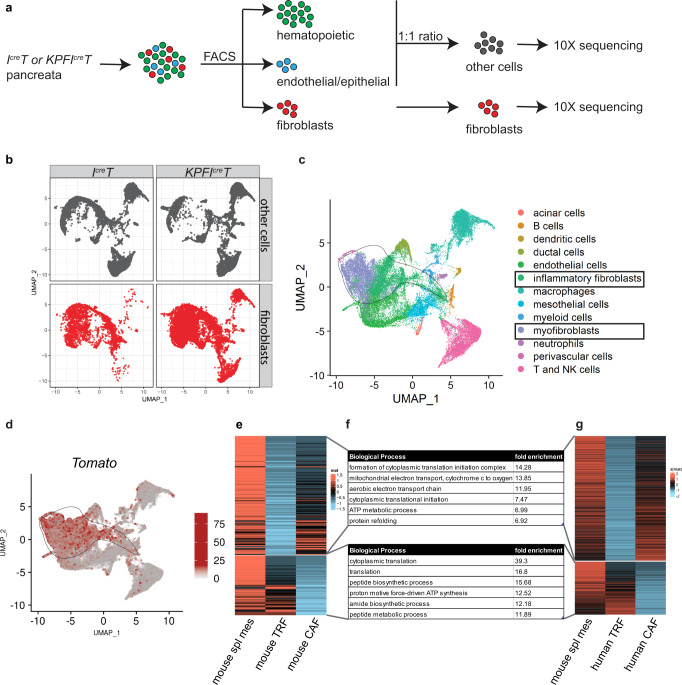
Fig. 5. Single-cell analysis of the KPFIcreT model suggests a conserved gene signature in the splanchnic lineage.
a Schematic of the single-cell RNA sequencing experimental design. Pancreata were dissociated into single cells and sorted into hematopoietic cells (CD45+), endothelial (CD31+)/epithelial (EPCAM+) cells or fibroblasts (PDPN+ or PDGFRα+, or Tomato+). Hematopoietic cells were combined with endothelial/epithelial cells with 1:1 ratio. Cells were then processed for 10X RNA sequencing. b The split view of each sample type in a merged UMAP space. c UMAP of cell clusters annotated based on marker gene expression. d Tomato gene expression projected onto the cell clusters. c, d The circled lines delineate the fibroblast cluster. e Heatmap of genes highly expressed in both the splanchnic mesenchyme and CAFs compared to TRFs (upper block), and genes highly expressed in both the splanchnic mesenchyme and TRFs compared to CAFs (lower block). f Top biological processes associated with genes identified in mouse analysis (e) and human analysis (g). g Heatmap of genes highly expressed in both the splanchnic mesenchyme and human pancreatic CAFs compared to human pancreatic TRFs (upper block), and genes highly expressed in both the splanchnic mesenchyme and human pancreatic TRFs compared to human pancreatic CAFs (lower block). Spl splanchnic, Meso mesoderm, CAFs cancer associated fibroblasts, TRFs tissue resident fibroblasts.

