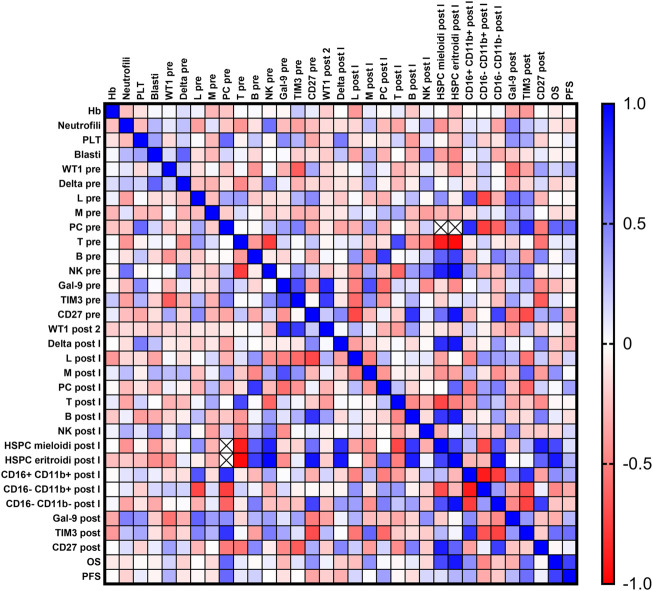
FIGURE 4.
Correlation analysis. Blood counts [hemoglobin (Hb), platelet count (PLT), absolute neutrophil count (ANC)], percent of bone marrow blasts, normalized WT1 mRNA expression, flow cytometry data [% of lymphocytes (Lymph), monocytes (Mono), plasma cells, T and B cells, Natural Killer (NK) cells, myeloid and erythroid hematopoietic stem and progenitor cells (HSPCs), and granulocyte maturation curve], galectin-9 (Gal-9), Tim-3, and CD27 expression levels, overall survival (OS), and progression-free survival (PFS) were compared at baseline and after treatment by Pearson correlation analysis. Positive correlations are displayed in blue (r = 1), and negative correlations in red (r = −1).

