FIGURE 1.

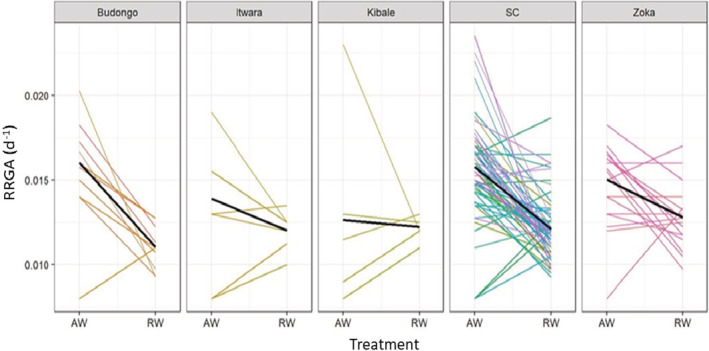
Mean RGRA (d−1) as a function of treatment (ample‐water (AW) and restricted‐water (RW) across genetic groups (panels) and genotypes (colored lines)). Solid black line shows the mean estimated response per genetic group

Mean RGRA (d−1) as a function of treatment (ample‐water (AW) and restricted‐water (RW) across genetic groups (panels) and genotypes (colored lines)). Solid black line shows the mean estimated response per genetic group