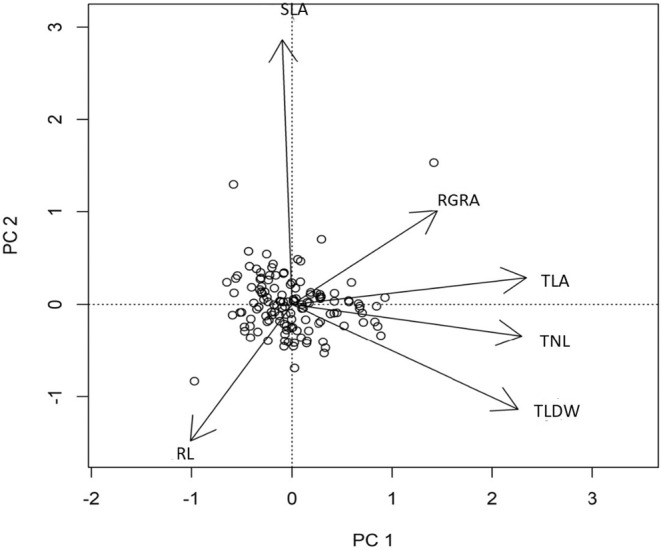
FIGURE 2.

Principal component analysis (PCA) of genotypic mean trait values showing multivariate dependency between the measured traits: Relative growth in leaf area (meanRGRA), Total number of leaves (mean TLA), Total leaf area (meanTNL), Total leaf dry weight (meanTLDW), specific leaf area (meanSLA), root volume to leaf area ratio (meanRL). The two first axis, PC1 and PC2, account for 46% and 20% of the total variation respectively.
