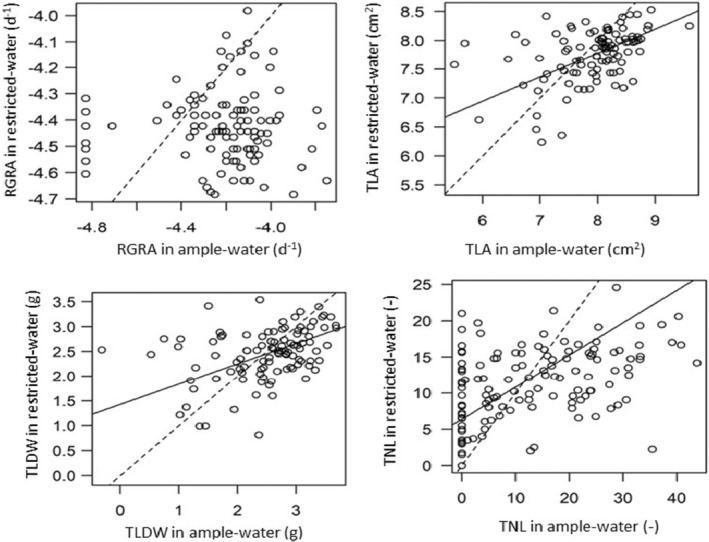
FIGURE 3.

Relationship between growth‐related traits in ample water versus restricted water. The relationships were fitted with type II regression. Plots with solid black lines show relationships that were significantly different from zero. For reference, 1:1 line is shown (dotted line).
