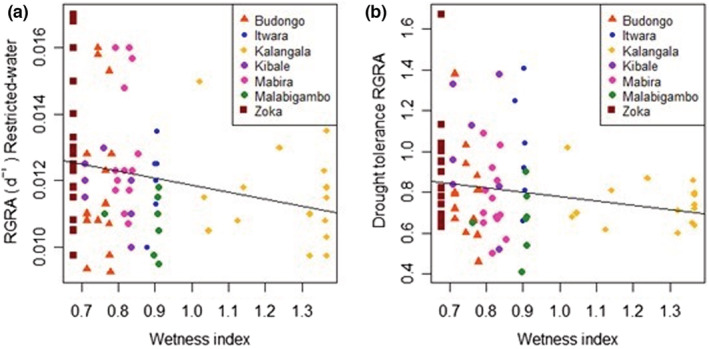
FIGURE 4.

Relationship between the performance of C. canephora genotypes in restricted‐water conditions and wetness index of the location in which they were collected from (a) and the relationship between drought tolerance as estimated from RGRA and wetness index of the location (b); wetness index (WI), high WI values indicate moist conditions and low WI values indicate dry conditions. Both slopes were negative and significantly different from zero at p = .05.
