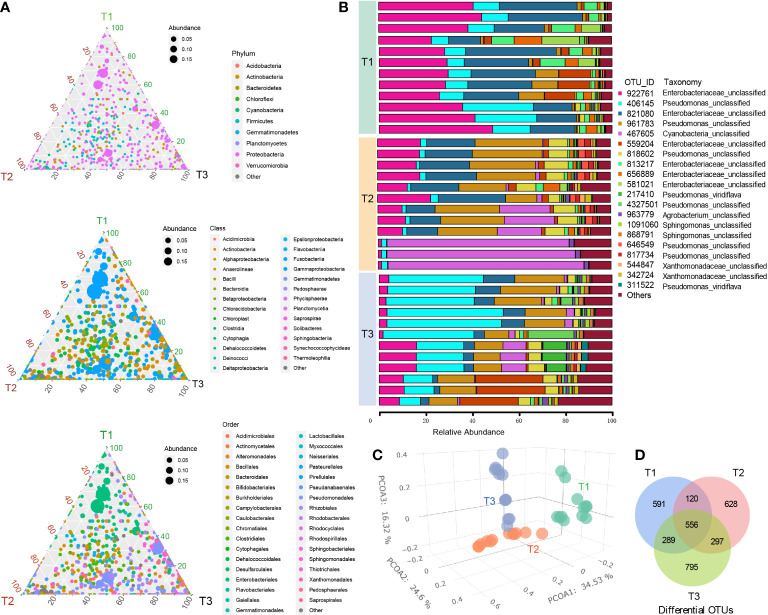
Figure 1.
Bacterial community composition and diversity in tobacco phyllosphere. (A) The ternary phase diagrams showing the relative abundance and relationships of the different taxonomic categories (top, phylum; middle, class; bottom, order) in the three time series groups (three vertices, T1, T2 and T3). The size of each circle is proportional to relative abundance; the closer the circle is to the vertex, the higher the relative abundance of the group in that group. (B) Stack bar chart showing the twenty most abundant OUT taxa in each sample. (C) Principal coordinate analysis (PCoA) of Bray–Curtis dissimilarity matrices showing effects of time series (T1, T2 and T3 groups) on the tobacco phyllospheric bacterial community structure. (D) Venn diagram depicting number of shared or unique OTUs in each time series group (T1, T2 and T3).

