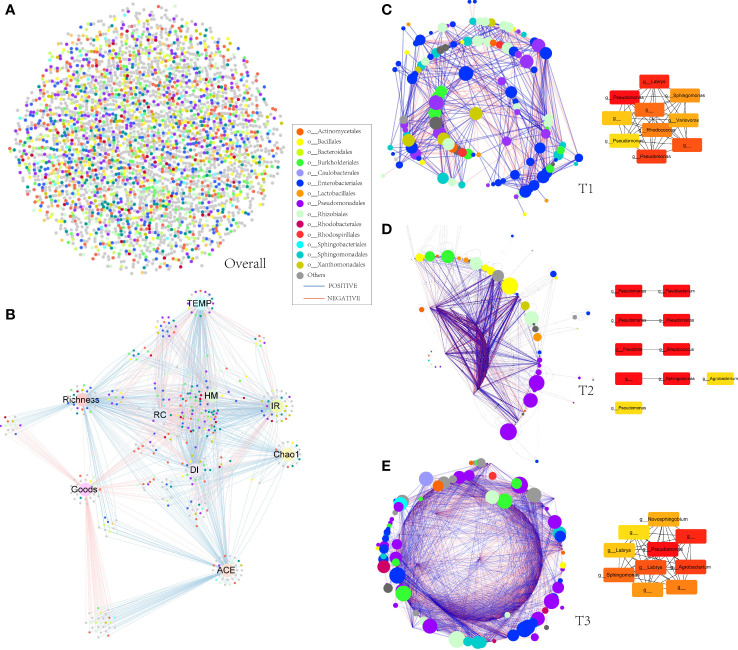
Figure 5.
Molecular ecological networks of phyllospheric bacterial community. Each node represents an OTU. The size of each node is proportional to the number of connections (that is, degree) and the colors of nodes represent different order. The links between the nodes indicate strong and significant (P < 0.01) correlations. A red line indicates a negative interaction between two individual nodes, while a blue line indicates a positive interaction. (A) Overall molecular ecological network; (B) spearman correlation between environmental factor, alpha diversity index, and OTUs. (C) molecular ecological network of T1 group (left) and predicted keystone nodes (right); (D) molecular ecological network of T2 group (left) and predicted keystone nodes (right); (E) molecular ecological network of T3 group (left) and predicted keystone nodes (right).

