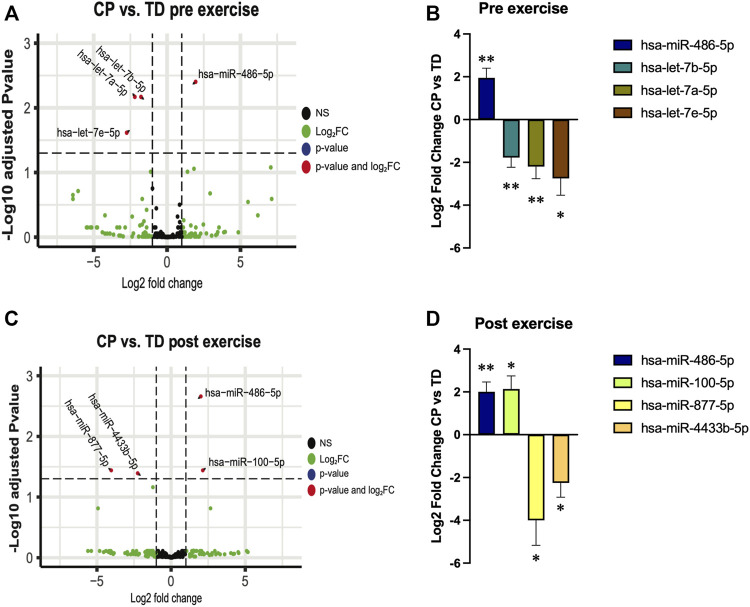
FIGURE 2.
Extracellular vesicles microRNA cargo differences between cerebral palsy (CP) and typically developed (TD) individuals before (pre exercise) and 30 min after (post exercise) a bout of aerobic exercise. (A,C); volcano plots illustrating changes in EV cargo between TD and CP before (A) and after (C) exercise. Each point on the scatter plot represents a microRNA where its position on the x-axis corresponds to the average log2-fold change after exercise and the position on the y-axis corresponds to log10 p-value of its differential expression after adjustment for false discovery rate. (B,D); bar graphs illustrating the expression of selected microRNAs in CP individuals relative to TD participants before (B) and after (D) exercise; **; p < 0.01, *; p < 0.05.

