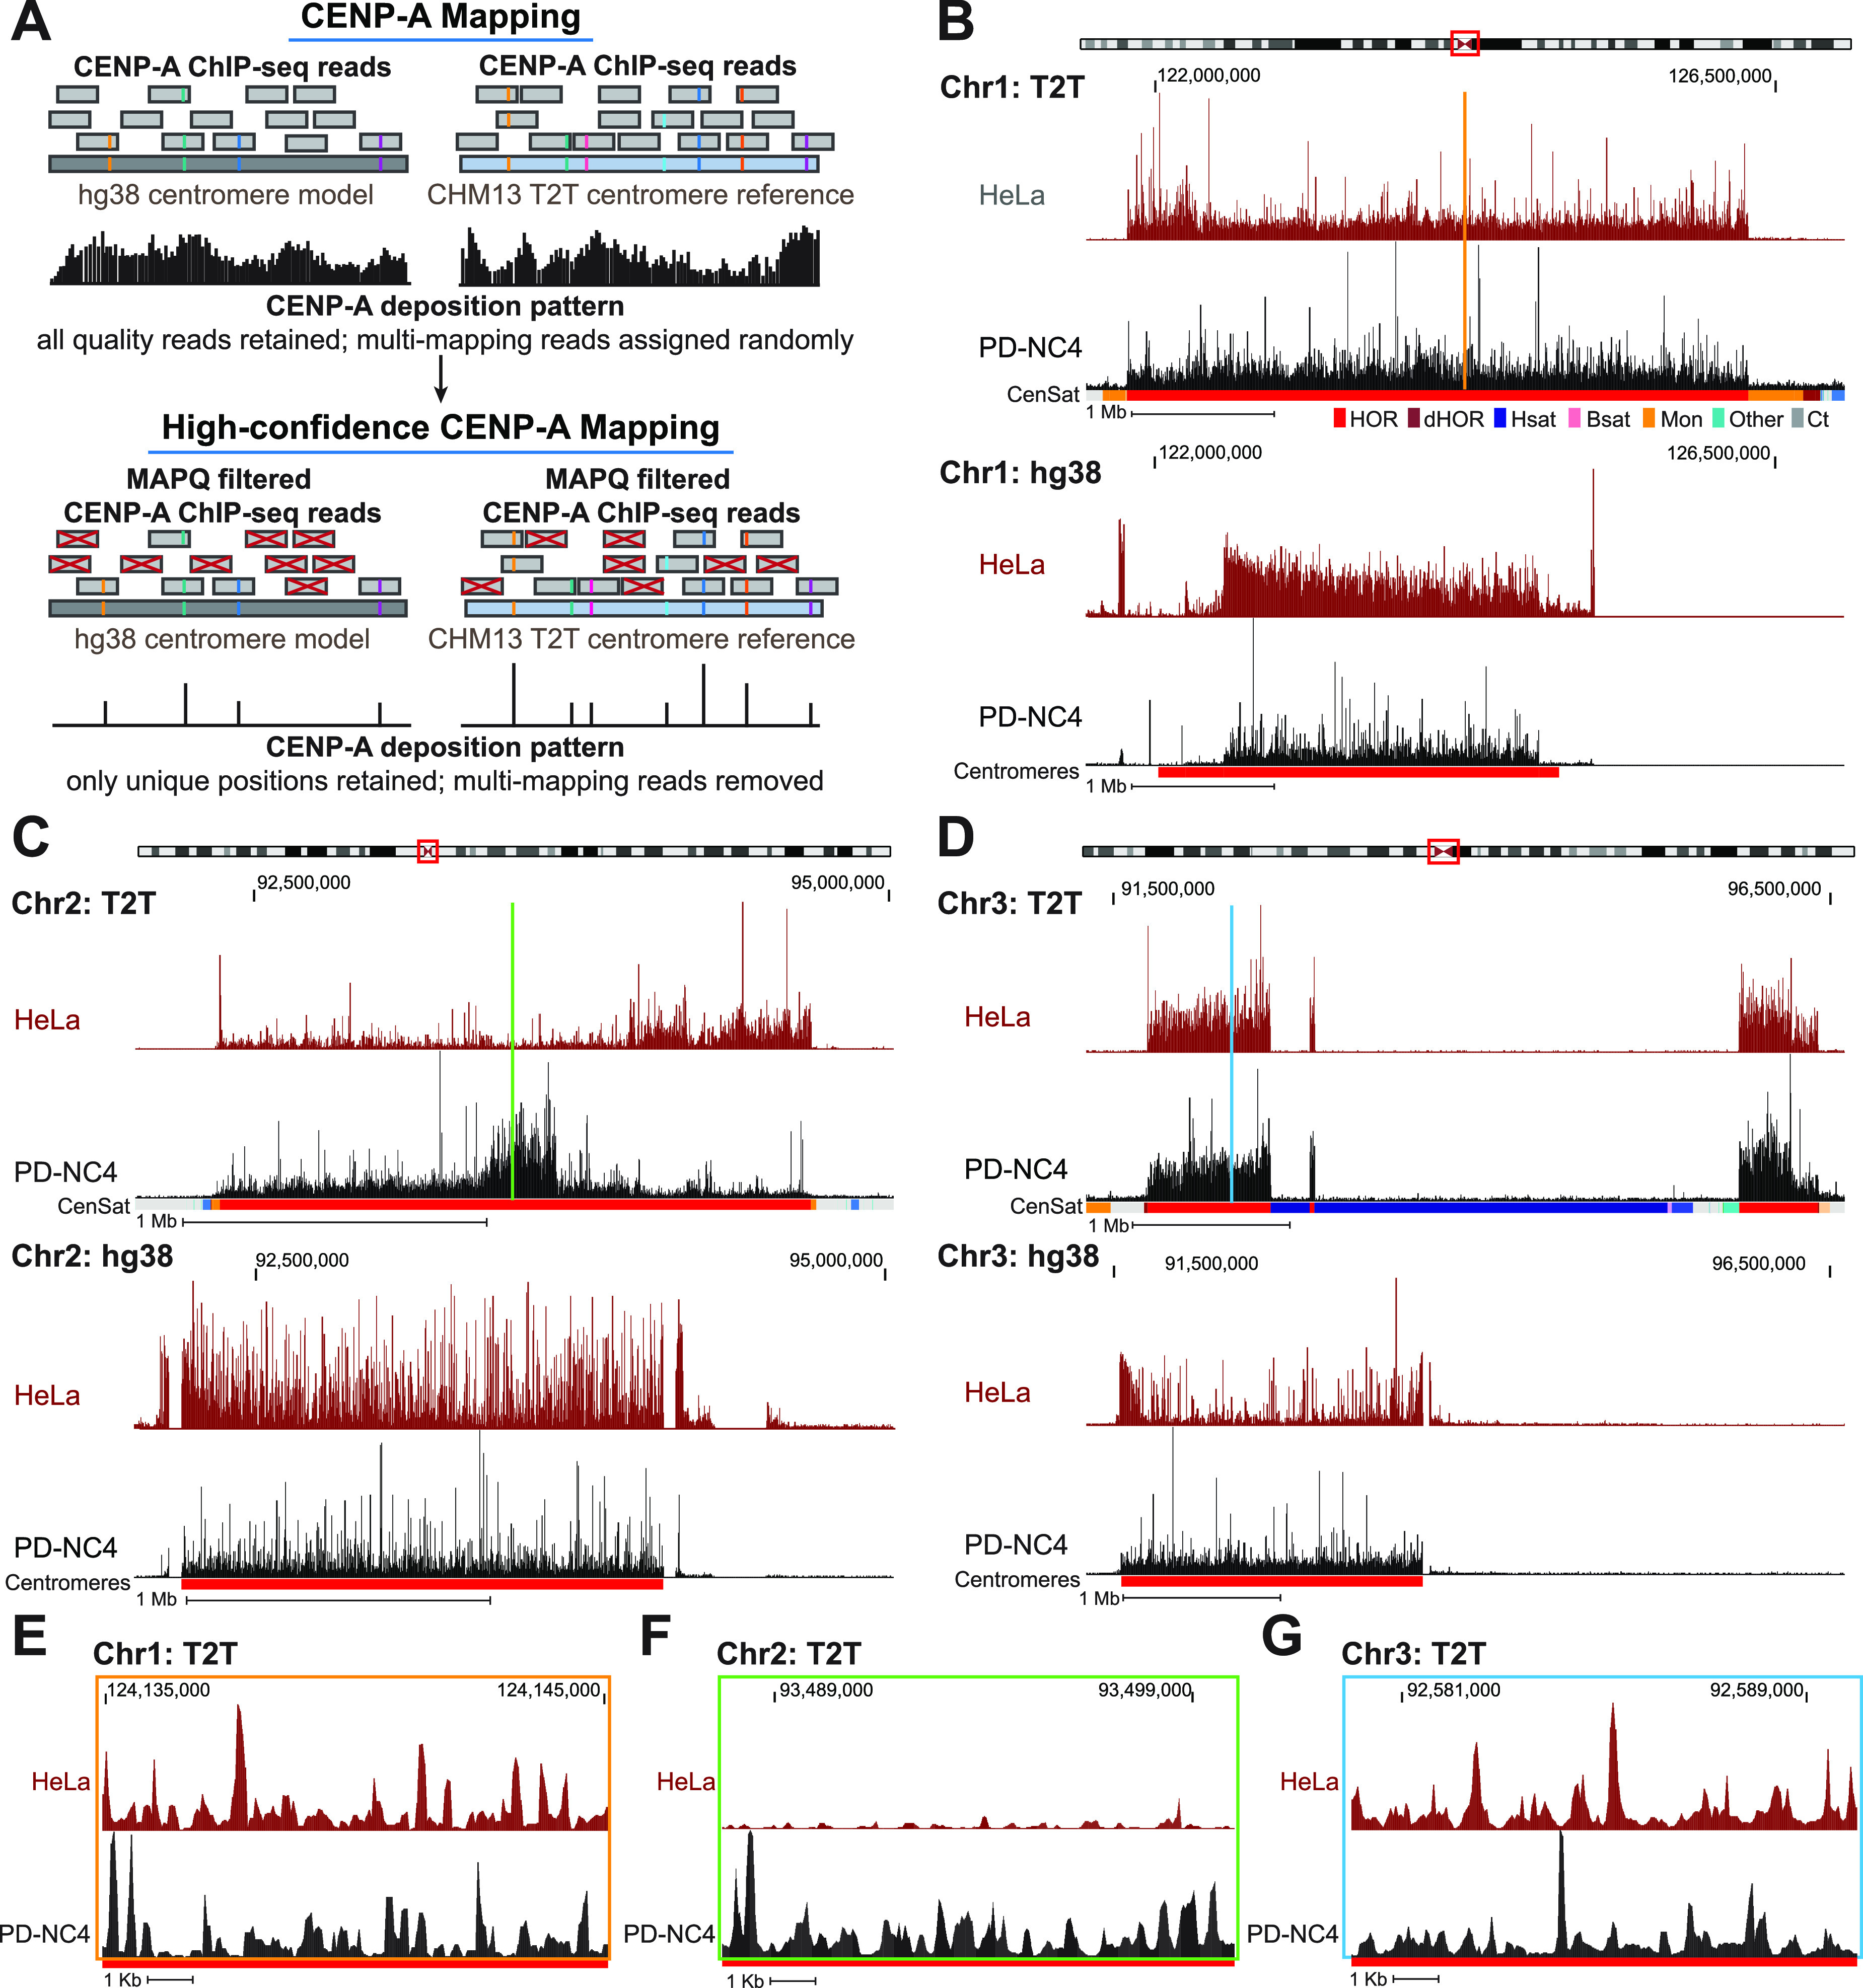
Figure 1. CENP-A alignment patterns differ dramatically between hg38 centromere reference models and T2T centromere sequences.

(A) Schematic representing conventional mapping of CENP-A–bound reads (top panel) and MAPQ-filtered high-confidence mapping of CENP-A–bound reads (bottom panel) to the hg38 (left) and T2T (right) assemblies. The higher number of unique variants in the T2T assembly allows for a greater number of high-confidence CENP-A reads to be mapped. Reads with colored lines represent unique variants within the α-satellite repeats. (B, C, D) Position of CENP-A reads in HeLa (maroon) and PD-NC4 (black) cells when mapped to the T2T (top) and hg38 (bottom) assemblies at the centromeres of chromosomes 1 (B), 2 (C), and 3 (D). Chromosome ideograms at top indicate position of the centromere. Annotation tracks below the T2T assembly indicate positions of centromeric satellites; see the color key in panel (B). (HOR = higher order repeats, red; dHOR = divergent higher order repeats, maroon; Hsat = human satellites, blue; Bsat = beta satellites, pink; Mon = monomers, orange; Others = other centromeric satellites, teal; Ct = centric satellite transition regions, grey). Annotation tracks below the hg38 assembly indicate positions of centromeres (red). Scale bar, 1 Mb. (E, F, G) High-resolution view of CENP-A reads in HeLa (maroon) and PD-NC4 (black) cells when mapped to the T2T assembly at the same centromeres shown in (B, C, D). Color-coded panels represent the colored locations indicated in (B, C, D). Scale bar, 1 Kb.
