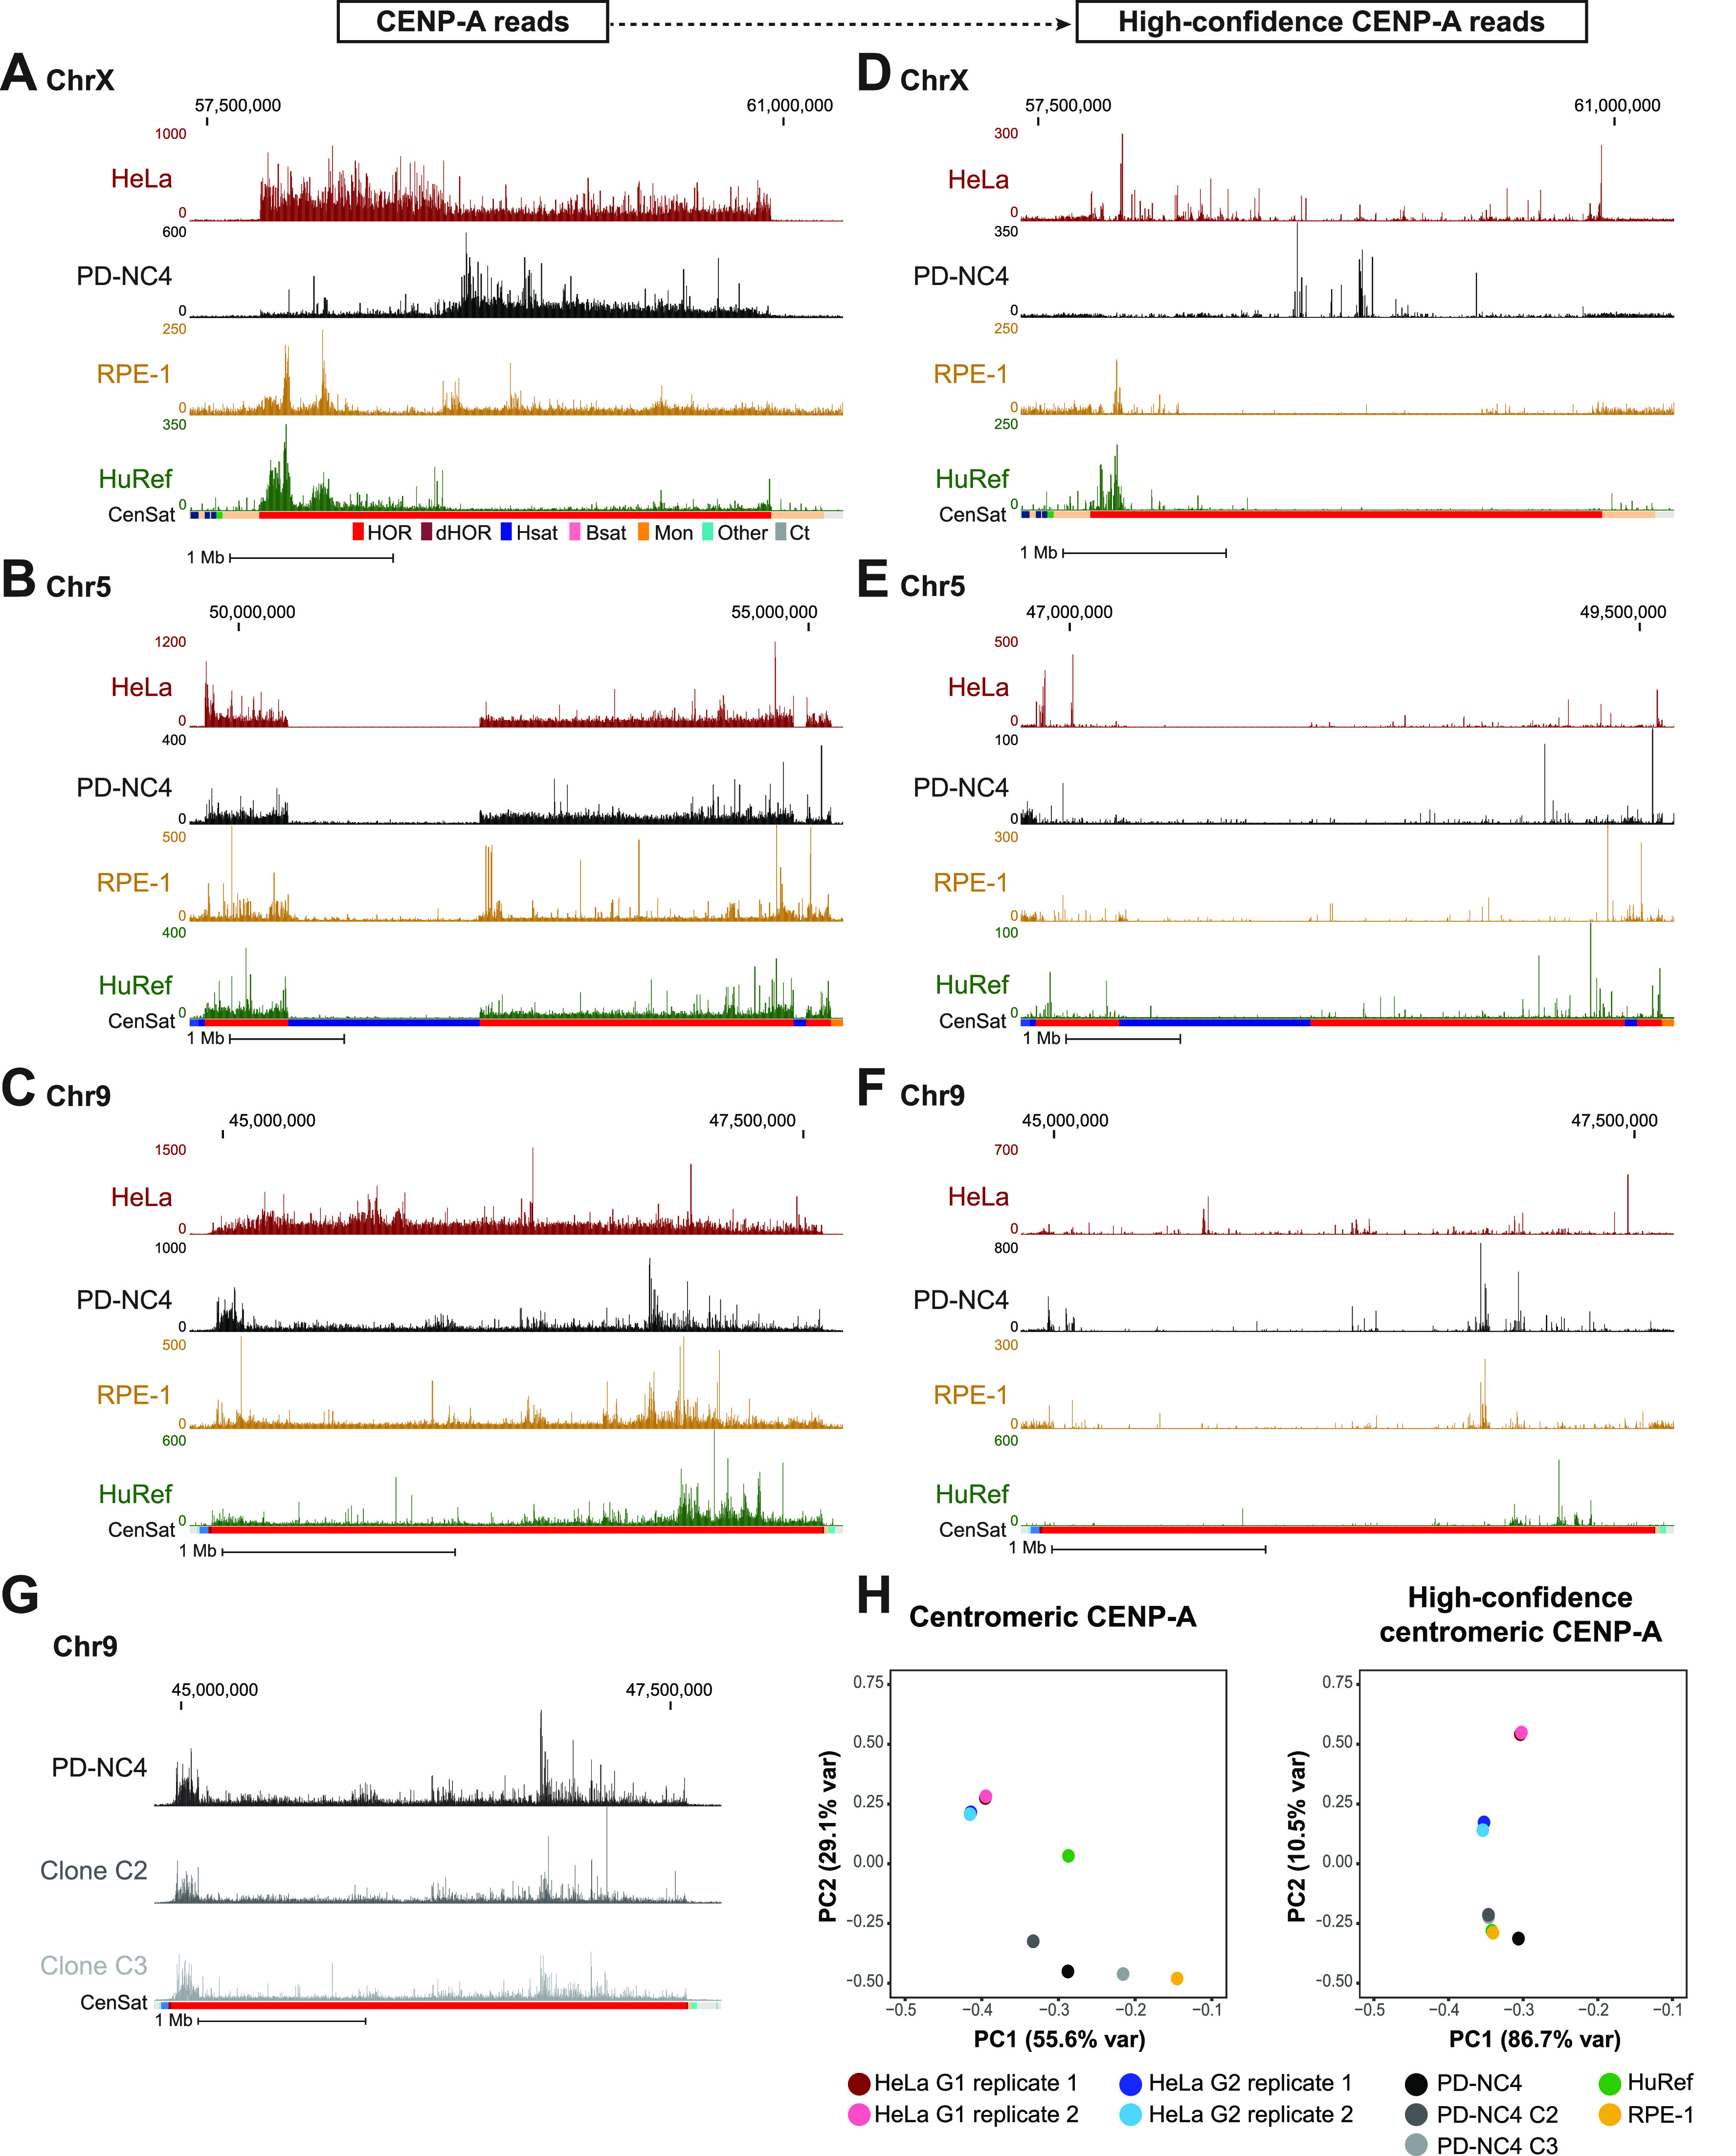
Figure 3. CENP-A position and high-confidence CENP-A binding sites differ between human cell lines.

(A, B, C) Mapping of CENP-A to chromosome X (A), chromosome 5 (B), and chromosome 9 (C) of the T2T assembly in HeLa (maroon), PD-NC4 (black), RPE-1 (yellow), and HuRef (green) cells. Scale bar, 1 Mb. Annotation tracks below the T2T assembly indicate positions of centromeric satellites; see color key in panel (A): (HOR = higher order repeats, red; dHOR = divergent higher order repeats, maroon; Hsat = human satellites, blue; Bsat = beta satellites, pink; Mon = monomers, orange; Others = other centromeric satellites, teal; Ct = centric satellite transition regions, grey). (D, E, F) Mapping of high-confidence CENP-A to chromosome X (D), chromosome 5 (E), and chromosome 9 (F) of the T2T assembly in HeLa, PD-NC4, RPE-1, and HuRef cells. Scale bar, 1 Mb. (G) Mapping of CENP-A reads from parental PD-NC4 fibroblasts and two single-cell–derived clones to the centromere of chromosome 9 in the T2T assembly. (H) PCA plots of significantly enriched centromeric CENP-A peaks (MACS2, P < 0.00001) at all (left panel) and high-confidence (right panel) positions in different human cell lines. HeLa G1 replicates, maroon and pink; HeLa G2 replicates, dark and light blue; PD-NC4 parental and derived clones, black and grey; RPE1, yellow; HuRef, green.
