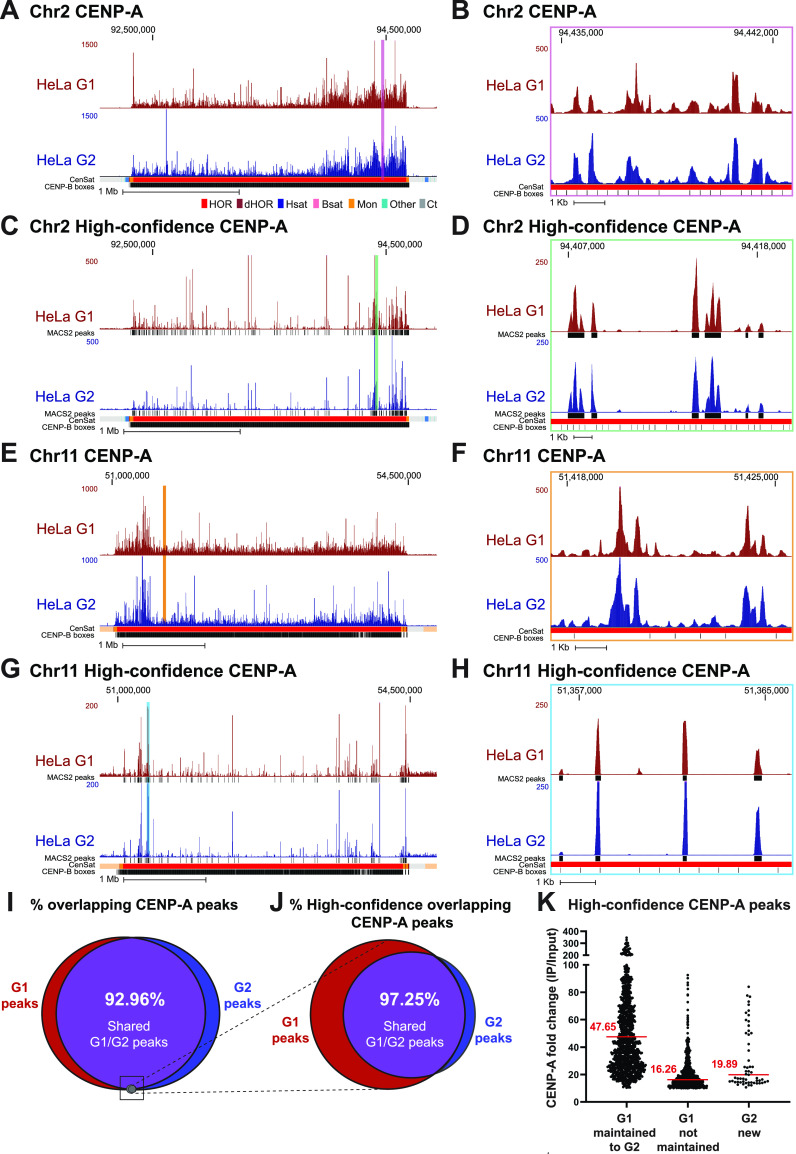
Figure 4. CENP-A nucleosomes are retained through DNA replication at human centromeres.
(A, B, C, D) CENP-A position in HeLa cells enriched at G1 (maroon) and G2 (blue) mapped to chromosome 2 of the T2T assembly with conventional mapping (A, B) and high-confidence mapping (C, D). (A, C); scale bar 1 Mb. (B, D); scale bar 1 Kb. Color coded panels (B, D) represent high-resolution view of the colored locations indicated in (A, C). MACS2 peaks in (C, D) in black indicate positions significantly enriched peaks for CENP-A (MACS2 P < 0.00001). Annotation tracks below the T2T assembly indicate positions of centromeric satellites; see color key in panel (A): (HOR = higher order repeats, red; dHOR = divergent higher order repeats, maroon; Hsat = human satellites, blue; Bsat = beta satellites, pink; Mon = monomers, orange; Others = other centromeric satellites, teal; Ct = centric satellite transition regions, grey). (E, F, G, H) CENP-A position in HeLa cells enriched in G1 and G2 mapped to chromosome 11 of the T2T assembly with conventional mapping (E, F) and high-confidence mapping (G, H). (E, G); scale bar 1 Mb, (F, H); scale bar 1 Kb. Color coded panels (F, H) represent high-resolution view of the colored locations indicated in (E, G). MACS2 peaks in (G, H) indicate positions of significantly enriched peaks for CENP-A (MACS2 P < 0.00001). Annotation tracks indicate positions of centromeric satellites (see color key in panel (A)) and position of CENP-B boxes. (I) Venn diagram depicting the percent overlap of significantly enriched CENP-A peaks identified in data from HeLa cells in G1 and G2 phases (MACS2 P < 0.00001, ≥10-fold enrichment). 93% of CENP-A peaks in G1 were retained in G2. Small grey circle represents the relative size (5.1%) of the high-confidence CENP-A peaks depicted in the venn diagram in (J). (J) Venn diagram depicting the percent overlap of significantly enriched CENP-A peaks identified in high-confidence CENP-A mapped reads from HeLa cells in G1 and G2 phases (MACS2 P < 0.00001, ≥10-fold enrichment). 97% of CENP-A peaks in G2 were precisely maintained from their existing position in G1. (K) Enrichment levels of significantly enriched (P < 0.00001, ≥10-fold enrichment) high-confidence CENP-A G1 peaks that are either maintained or not maintained into G2. Peaks that were maintained from G1 to G2 had a median enrichment value of 47.65-fold. G1 peaks that were not maintained to G2 had a median enrichment value of 16.26-fold. New G2 peaks that were not present in G1 had a median enrichment value of 19.89-fold.

